Overall, most Americans view the election rules in their state as fair, and a majority say the rules make registering and voting neither too hard nor too easy.
There are partisan and demographic differences in assessments of state election rules. And these differences are especially large in opinions about whether blacks, Hispanics and lower-income citizens have equal access to voting in their state.
General assessments of state election rules
 A sizable majority of the public (83%) says election rules in their state are fair; only 15% say the rules are not fair.
Majorities of white (88%), black (74%) and Hispanic adults (69%) say elections are fair where they live. But more blacks and Hispanics than whites say election rules are not fair: 25% of blacks, and a similar share of Hispanics (27%), say election rules in their state are not fair; about one-in-ten white adults (11%) say the same.
Republicans and Democrats broadly agree that election rules in their state are fair. Yet a larger minority of Democrats and Democratic-leaning independents (20%) than Republicans and Republican leaners (10%) say the election rules in their state are not fair.
Too easy or too hard to vote?
 A wide majority of Americans say election rules make registering and voting in their state neither too easy nor too hard: 69% say the rules are “about right,” compared with 19% who say it is too easy and 10% who say it is too hard.
Across demographic groups, majorities say the election rules in their state do not make it too hard – or too easy – to register and vote. Comparable shares of whites (70%), blacks (68%) and Hispanics (69%) say the rules are about right in their state.
Broad majorities in all age groups say voting is neither too easy nor too hard. However, adults ages 50 and older are more likely than those younger than 50 to say it is too “easy” (24% vs. 14%).
Partisan differences in views of state election rules
 Nearly identical shares of Republicans (70%) and Democrats (71%) view the election rules in their state as “about right.” But Democrats are more likely than Republicans to say the rules in their state make it too hard to register and vote (16% vs. 4%), and Republicans are more likely to view them as too easy (26% say this, along with just 12% of Democrats).
Republicans in states with election laws that make voting more accessible – by allowing absentee voting without an excuse, early voting or voting by mail – are more likely than Republicans in states with less accessible rules to say voting is too easy. About three-in-ten Republicans in states with more accessible voting (28%) say it is too easy to vote versus about two-in-ten in less accessible states (18%).
Democrats’ views of their state’s election rules, by contrast, do not differ in states with more or less accessible voting rules. (See appendix for details on state classification.)
Race, ethnicity, income and access to voting
 Asked about whether racial and ethnic minorities have the same access to voting as white citizens in their state, most Americans say that black citizens (80%) and Hispanic citizens (69%) have equal access.
About a quarter (27%) say Hispanic citizens have less access to voting than white citizens. And 17% say black citizens have less access than whites.
Three-in-ten Americans say lower-income citizens have less access to voting than middle-income citizens, while two-thirds (67%) say lower-income and middle-income citizens have equal access.
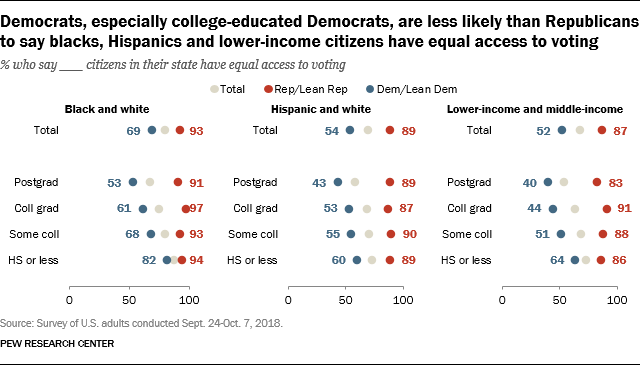
Democrats are far more likely than Republicans to say blacks, Hispanics and lower-income citizens lack equal access to voting. Slightly more than half of Democrats (54%) say Hispanics and whites have equal access to voting in their state; a comparable share of Democrats (52%) say lower- and middle-income citizens have equal access to voting. Overwhelming shares of Republicans say both groups have equal access to voting in their state (89% Hispanics, 87% lower-income citizens).
More Democrats say blacks have equal access to voting with whites (69%) than say this about Hispanics (54%). Still, a much larger share of Republicans (93%) say black and white citizens in their state have equal access to voting.
There are sizable educational differences among Democrats in views of whether minorities and lower-income citizens lack equal access to voting. Democrats with a four-year degree or postgraduate degree are less likely than those with less education to say that blacks, Hispanics and lower-income citizens have equal access to voting in their state. There are no significant educational differences among Republicans in these views.

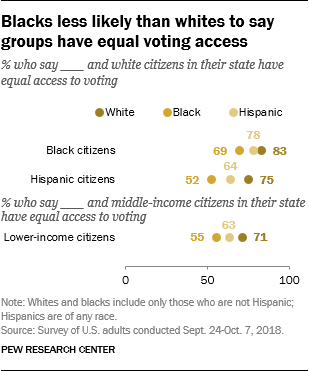
Whites are generally more likely than blacks or Hispanics to say there is equal ballot access for racial and ethnic minorities in their state.
 Roughly eight-in-ten whites (83%) and Hispanics (78%) say black citizens and white citizens have equal access to voting. By comparison, 69% of blacks say the same.
And while 75% of whites say Hispanic citizens have the same access to voting as whites, a smaller majority of Hispanics (64%) and only about half of blacks (52%) agree.
There are similar gaps in views about lower-income citizens access to voting. While about seven-in-ten whites (71%) say lower-income citizens and middle-income citizens have equal access to voting, 63% of Hispanics and 55% of blacks say this.
While a majority of blacks say blacks and whites have equal voting access in their state, their opinions differ by education: 72% of blacks who have not completed college say blacks and whites have equal access, compared with 55% of black college graduates. There is a similar 17-percentage-point education gap among whites: 89% of those who have not completed college, compared with 72% of those with a college degree, say blacks and whites have equal voting access.
While there also are educational differences among whites in views of access to voting for Hispanic and lower-income citizens, there are no significant educational differences among blacks or Hispanics in these views.
 Fairness of election rules and congressional districting
 A quarter of Americans say the election rules in their state unfairly favor either the Republican Party (14%) or the Democratic Party (11%). Nearly three-quarters of Americans (73%) say that election rules do not favor one party over the other.
Among those living in states with more than one congressional district, nearly four-in-ten (37%) say the way congressional districts are drawn in their state unfairly favors one party over the other: 22% say it unfairly favors the GOP, while 15% say the Democratic Party. Still, 58% of adults in these states say congressional districts are drawn in a way that doesn’t favor one party over the other.
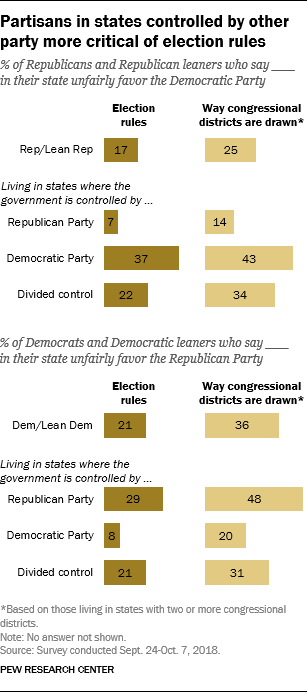
 Comparable shares of Democrats (21%) and Republicans (17%) say their state’s election rules unfairly favor the opposing party.
But in multi-district states, Democrats (36%) are more likely than Republicans (25%) to say that the way congressional districts are drawn unfairly favors the other party.
Republicans’ and Democrats’ views of fairness regarding election rules and the way congressional districts are drawn vary widely based on whether or not their party has control of the state government.
 About four-in-ten Republicans living in Democratic-controlled states (37%) say election rules unfairly favor the Democratic Party, while 22% of Republicans in states with divided governments say this. Just 7% of Republicans in GOP-controlled states say the rules favor the Democratic Party in their state.
There is a parallel pattern of opinion among Democrats. While 29% of those in states with unified Republican Party control of government say the rules unfairly favor the GOP, that drops to 21% in states with divided control and just 8% in states controlled by the Democratic Party.
When it comes to the way congressional districts are drawn in the states with multiple districts, nearly half of Democrats living in GOP-controlled states (48%) say district boundaries unfairly favor Republicans; 31% say this in states with divided control, while 20% say this in states under unified Democratic Party control.
Again, there is a similar pattern among Republicans: 43% of those living in Democratic-controlled states with two or more representatives in Congress say district lines favor the Democratic Party, this drops to 34% among those in states with divided control and just 14% in states under GOP control.


