The American Trends Panel (ATP), created by Pew Research Center, is a nationally representative panel of randomly selected U.S. adults recruited from landline and cellphone random-digit-dial surveys. Panelists participate via monthly self-administered web surveys. Panelists who do not have internet access are provided with a tablet and wireless internet connection. The panel is being managed by GfK.
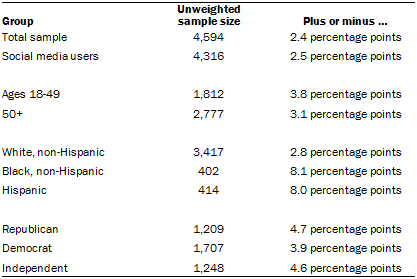
Data in this report are drawn from the panel wave conducted May 29-June 11, 2018, among 4,594 respondents. The margin of sampling error for the full sample of 4,594 respondents is plus or minus 2.4 percentage points.
Members of the American Trends Panel were recruited from several large, national landline and cellphone random-digit-dial (RDD) surveys conducted in English and Spanish. At the end of each survey, respondents were invited to join the panel. The first group of panelists was recruited from the 2014 Political Polarization and Typology Survey, conducted Jan. 23-March 16, 2014. Of the 10,013 adults interviewed, 9,809 were invited to take part in the panel and a total of 5,338 agreed to participate.6 The second group of panelists was recruited from the 2015 Pew Research Center Survey on Government, conducted Aug. 27-Oct. 4, 2015. Of the 6,004 adults interviewed, all were invited to join the panel, and 2,976 agreed to participate.7 The third group of panelists was recruited from a survey conducted April 25-June 4, 2017. Of the 5,012 adults interviewed in the survey or pretest, 3,905 were invited to take part in the panel and a total of 1,628 agreed to participate.8
The ATP data were weighted in a multi-step process that begins with a base weight incorporating the respondents’ original survey selection probability and the fact that in 2014 some panelists were subsampled for invitation to the panel. Next, an adjustment was made for the fact that the propensity to join the panel and remain an active panelist varied across different groups in the sample. The final step in the weighting uses an iterative technique that aligns the sample to population benchmarks on a number of dimensions. Gender, age, education, race, Hispanic origin and region parameters come from the U.S. Census Bureau’s 2016 American Community Survey. The county-level population density parameter (deciles) comes from the 2010 U.S. Decennial Census. The telephone service benchmark comes from the July-December 2016 National Health Interview Survey and is projected to 2017. The volunteerism benchmark comes from the 2015 Current Population Survey Volunteer Supplement. The party affiliation benchmark is the average of the three most-recent Pew Research Center general public telephone surveys. The internet access benchmark comes from the 2017 ATP Panel Refresh Survey. Respondents who did not previously have internet access are treated as not having internet access for weighting purposes. Sampling errors and statistical tests of significance take into account the effect of weighting. Interviews are conducted in both English and Spanish, but the Hispanic sample in the American Trends Panel is predominantly native born and English speaking.
The following table shows the unweighted sample sizes and the error attributable to sampling that would be expected at the 95% level of confidence for different groups in the survey:

Sample sizes and sampling errors for other subgroups are available upon request.
In addition to sampling error, one should bear in mind that question wording and practical difficulties in conducting surveys can introduce error or bias into the findings of opinion polls.
The May 2018 wave had a response rate of 84% (4,594 responses among 5,486 individuals in the panel). Taking account of the combined, weighted response rate for the recruitment surveys (10.1%) and attrition from panel members who were removed at their request or for inactivity, the cumulative response rate for the wave is 2.4%.9
Twitter analysis
This report contains two different analyses of Twitter hashtags: an analysis of the volume of tweets over time mentioning certain hashtags and a content analysis of the major topics mentioned in tweets using a specific subset of hashtags. Each is discussed in greater detail below.
Hashtag usage analysis
To examine the frequency with which certain hashtags are used on Twitter, researchers used Crimson Hexagon, a Twitter analysis service, to count the total number of tweets per day mentioning each of the following hashtags for the time period starting Jan. 1, 2013 and ending May 1, 2018:
- #BlackLivesMatter
- #BlueLivesMatter
- #AllLivesMatter
- #MAGA
- #MeToo
- #Resist
- #JeSuisCharlie
- #LoveWins
Content analysis of tweets referencing #BlackLivesMatter and related hashtags
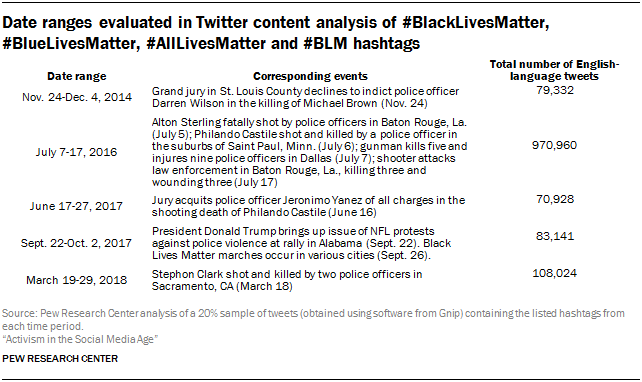
In addition to analyzing the frequency with which certain hashtags are used on Twitter, the Center also conducted a content analysis of tweets referencing the #BlackLivesMatter, #BlueLivesMatter, #AllLivesMatter, and #BLM hashtags. The usage of each of these hashtags tends to spike around major news events. Accordingly, researchers selected tweets from five different time periods close to major news events in order to better understand the nature of the conversation occurring around those hashtags during these high-volume periods. The five time periods chosen were as follows:

Researchers collected a 20% sample of all publicly available, English-language tweets during the time periods listed above that contained the following hashtags: “#BlackLivesMatter,” “#BlueLivesMatter,” “#AllLivesMatter,” and “#BLM.” The tweets were collected using Twitter’s Gnip API (application program interface). In total, this initial selection process resulted in 1,498,352 total tweets mentioning one or more of these hashtags.
Human coding of a subset of tweets
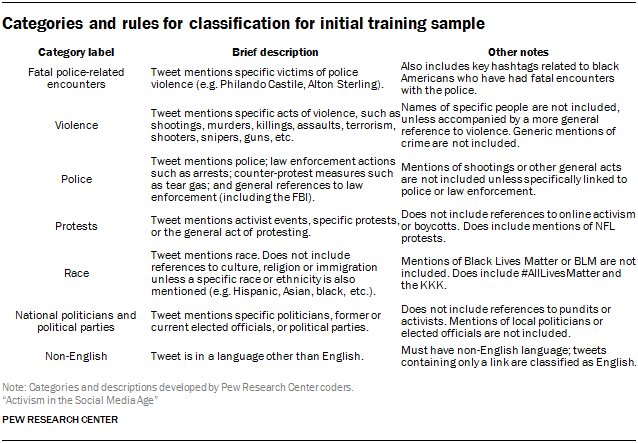
From this 20% sample of tweets, researchers selected a random representative sample of 250 tweets using the simple random sample function in Python. Each of these 250 tweets was hand-coded by Pew Research Center staff into the following categories (outlined in the table below) based on the content of the tweet. With the exception of the “non-English” item, these categories are non-exclusive: any individual tweet could be categorized into any number of these categories.

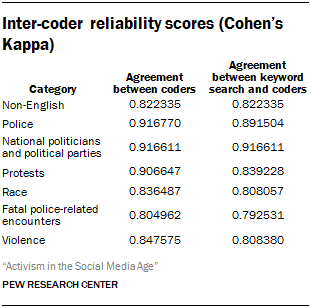
 To test the validity of the coding scheme, two coders were given a sample of 250 tweets to code according to these rules. The rate of agreement between coders was consistently near or above 80% and the Cohen’s Kappa scores were consistently above 0.8.10
Once this initial sample of 250 tweets was grouped into categories, researchers identified the keywords that best differentiated these categories from each other. An automated search for tweets containing this list of keywords for each category was tested against the reliability of the coders. The rate of agreement between the keyword search and the coders was consistently around 80%-92%.
Topic modeling analysis using category keywords
For the final step in this process, researchers calculated the prevalence of each topic across the entirety of the 20% sample of tweets.
First, tweets that were not in English were removed using a python package called “langdetect” that references the Google language detection library. Tweets were considered non-English if the algorithm determined there was 0% chance the tweet was in English. Removal of these non-English tweets produced a final total of 1,312,385 tweets to be analyzed by keyword.
Once these non-English tweets were removed, researchers used an automated process to search each of the remaining tweets for the keywords listed above and to classify them into the appropriate categories.
© Pew Research Center, 2018


