Americans’ attitudes about tipping – as well as their tipping habits – vary by age, income and other factors, according to a new Pew Research Center survey. But their approach to tipping also varies somewhat depending on whether they have worked for tips themselves at some point.
Pew Research Center conducted this analysis to understand how views and behaviors around tipping differ for U.S. adults who have and haven’t ever worked for tips themselves.
This analysis is based on a survey of 11,945 U.S. adults conducted Aug. 7-27, 2023. Everyone who took part is a member of the Center’s American Trends Panel (ATP), an online survey panel that is recruited through national, random sampling of residential addresses. Address-based sampling ensures that nearly all U.S. adults have a chance of selection. The survey is weighted to be representative of the U.S. adult population by gender, race, ethnicity, partisan affiliation, education and other categories. Read more about the ATP’s methodology.
Here are the questions used for this analysis, along with responses, and the survey methodology.
Overall, 43% of U.S. adults say they have ever personally worked in a job where they received tips. Roughly six-in-ten (57%) have not had this experience. Younger adults, those in lower-income households and women are all somewhat more likely than others to have worked in this type of job. Even so, no more than about half among each of these groups say they’ve worked for tips.

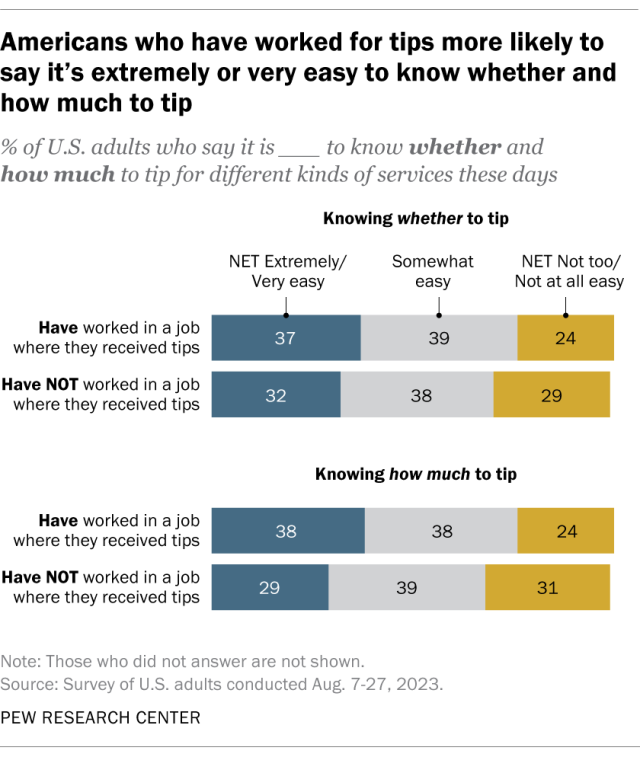
Adults who have ever worked in a job where they received tips are more likely than those who have not to say it’s very or extremely easy to understand tipping etiquette. About four-in-ten adults in this group (38%) say it’s very or extremely easy to know how much to tip for different kinds of services these days, compared with 29% of those who have never worked a job with tips. Adults who have worked for tips are also slightly more likely to say it’s very or extremely easy to know whether to tip at all (37% say this, compared with 32% who’ve never worked for tips).
Related: Do You Tip More or Less Than the Average American?
Tipping for services

Americans who have worked for tips at some point report tipping more frequently for certain services compared with those who’ve never worked in such a job.
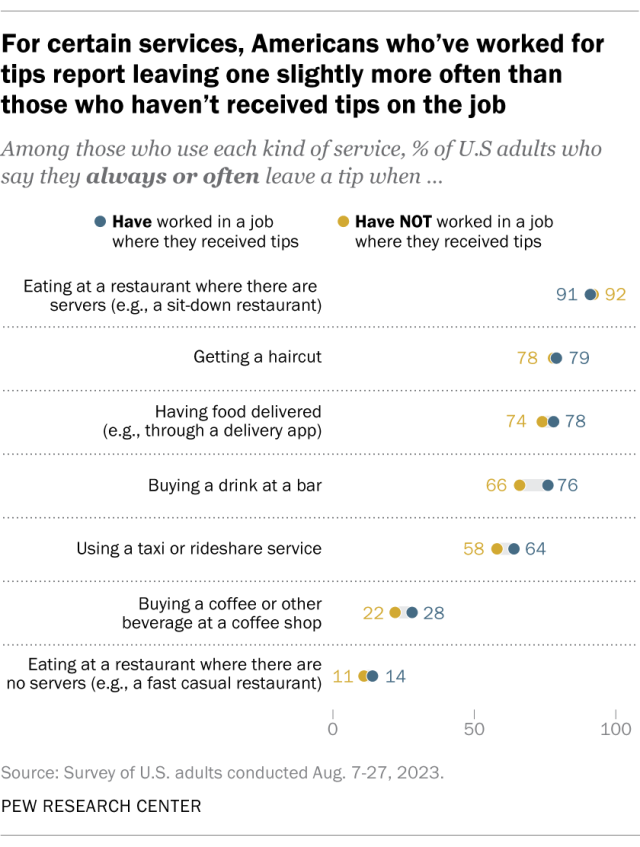
To assess these patterns, we asked Americans how often they leave a tip when using seven different types of services, ranging from sit-down restaurants to taxis or rideshares. Among people who say they use each type of service, adults who have personally worked for tips are more likely than those who haven’t to say they’d always or often leave a tip in certain situations. For example:
- Buying a drink at a bar: 76% of people who have ever worked for tips say they always or often leave a tip, compared with 66% of those who haven’t worked for tips.
- Using a taxi or rideshare service: 64% of those who have personally worked for tips say they always or often tip the driver, compared with 58% of those who haven’t worked for tips.
- Buying a coffee or other beverage at a coffee shop: 28% of those who’ve worked for tips say they always or often tip the barista, compared with 22% who haven’t worked for tips.
Adults who have ever worked at a job with tips are also slightly more likely than those who have not to say they always or often tip when having food delivered and when eating at a restaurant where there are no servers, such as a fast casual restaurant. But similar shares in both groups say they always or often leave a tip while eating at a restaurant where there are servers (about nine-in-ten each say this) and getting a haircut (around eight-in-ten each say this).
It’s important to note that these figures refer only to adults who use each type of service – not all adults.
How much to tip?

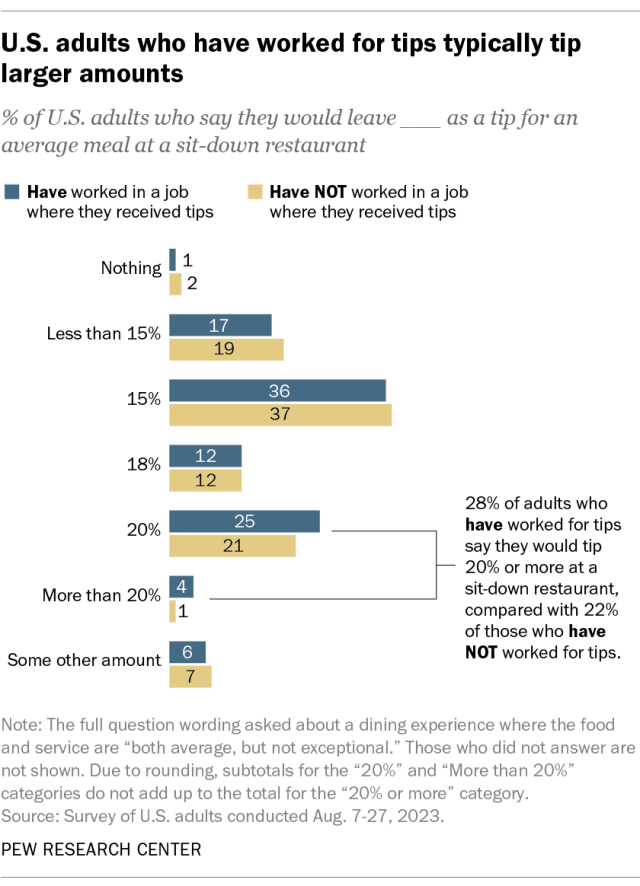
Americans who have worked for tips also report tipping larger amounts than those who haven’t. To gauge common tipping amounts at restaurants, we asked Americans how much they would tip at a place where a server took their order, and where the food and service were both average, but not exceptional.
Among those who have worked for tips, about three-in-ten (28%) say they would leave a tip of 20% or more in this situation. By comparison, roughly two-in-ten adults who haven’t worked for tips (22%) say they would tip that amount.
Those who haven’t worked for tips are also somewhat more likely to leave a tip of 15% or less: 59% say this, compared with 54% of those who’ve worked for tips themselves.
Views on businesses’ tipping policies
Americans who have personally worked for tips at some point have slightly more favorable views of certain tipping practices, such as businesses giving their customers suggestions about how much to tip – for example, on the bill or on a screen at the cash register. Nearly three-in-ten (27%) of those who have worked for tips favor this practice, compared with 22% of those who haven’t.
Those who have worked for tips are also slightly more likely to favor businesses including an automatic service charge or tip on the bill, regardless of party size (12% vs. 8%). Those who haven’t worked for tips are instead somewhat more likely to oppose these charges. For example, 53% of this group say they strongly oppose them, compared with 47% of those who’ve worked for tips at some point.
Still, in both groups, more adults oppose than favor suggested tip amounts and automatic service charges.
Note: Here are the questions used for this analysis, along with responses, and the survey methodology.


