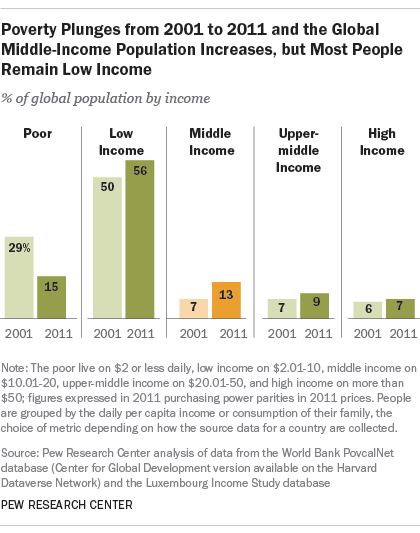
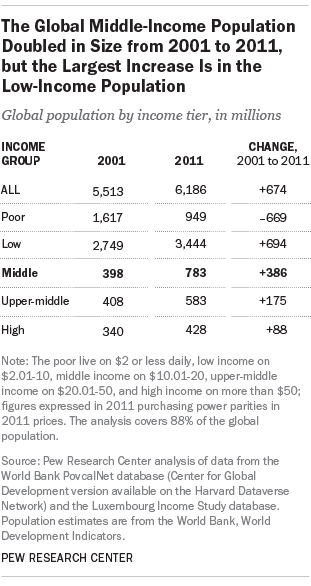
 During the first decade of this century, the world experienced a dramatic drop in the number of people living in poverty and a significant rise in the number who could be considered middle income, according to a new Pew Research Center report. But the majority of the global population remains low income.
Our analysis includes 111 countries, which accounted for 88% of the global population in 2011, the latest year that could be analyzed with the available data.
Here are six key takeaways from the report on how these big global changes have played out recently:
1The world’s middle-income population – people living on $10-20 per day – nearly doubled, increasing by 386 million from 2001 to 2011. In the 111 countries included in the report, some 783 million people were middle income in 2011, compared with 398 million in 2001. Looked at by share, the global middle class increased from 7% of the world’s population in 2001 to 13% in 2011.
2The emergence of a truly global middle class is still more promise than reality. The growth in the middle-income population was concentrated in particular regions. China, South America and Eastern Europe are home to some of the biggest increases. China alone accounted for more than half the additions to the global middle-income population from 2001 to 2011, with 203 million. Countries in South America and in Eastern Europe added 50 million and 39 million to the global middle class, respectively. By contrast, Africa and much of Asia, including India, have lagged behind.
3The standard of living of the global middle class is modest by Western norms. The $10-20 a day that qualifies people as middle income globally translates to $14,600 to $29,200 annually for a family of four. Much of the global middle class would officially be poor in the U.S., where the poverty line for a family of four was $23,021 in 2011. That year, only 16% of the world’s population was living on $20 or more a day, a little higher than the U.S. poverty line.
 4While the global middle-income population has grown from 2001 to 2011, the largest increase is in the world’s low-income population. The share of people classified as low income ($2-10 per day) increased from 50% of the world’s population in 2001 to 56% in 2011, and the low-income population increased from 2.7 billion to 3.4 billion. Overall, the vast majority of the world’s population (71%) was still either poor or low income in 2011.
5The number of people in poverty – living on $2 or less daily – plunged from 2001 to 2011, falling from 1.6 billion to 949 million. The share of the world’s population that is poor dropped from 29% to 15%. But in most countries, the majority of those emerging from poverty took only a modest step up the income ladder, changing their status from poor to low income. That has been the case in India and African countries, where poverty rates fell significantly since 2001, but most of the movement there was from poverty to low-income status.
6Only 7% of the global population was high income in 2011, with $50 or more at its disposal daily. Europe and North America dominate the topmost rung of the world’s income ladder, with some 87% of the global high-income population living there in 2011. That share is down only slightly, from 91% 2001. Within this group, Western Europe gained on the U.S. with respect to the shares of their populations that are high income. The role of advanced economies in the growth of the new middle classes is limited, because most residents in these countries were already either upper-middle income or high income by global standards in 2001.
Correction: This post was updated Aug. 13, 2015, to reflect changes to some aggregated data as a result of corrected estimates for Iceland, Luxembourg, the Netherlands and Taiwan.


