 When members of Congress posted in support of or opposition to political candidates, their Facebook audiences engaged more compared with posts that did not. At the same time, an increasingly large proportion of “reactions” to congressional posts – a set of emoji introduced by Facebook in February 2016 to capture user’s responses – featured the “anger” reaction. Over the full range of the study, legislators’ Facebook audiences liked congressional posts over 481 million times, created more than 45 million comments in response to posts, and shared the posts over 141 million times. Those audiences also used the “angry” reaction more than 24 million times.
This analysis uses statistical models to examine how the presence of support or opposition in a Facebook post can affect the number of likes, comments and shares it receives. The models help account for other factors that could impact that post’s engagement, such as the number of followers a given post’s author has and when it was posted. See methodology section for additional details. All of the reported results are based on the entire three-year time frame.
The Facebook audience engaged with oppositional posts more than with ones that didn’t take sides
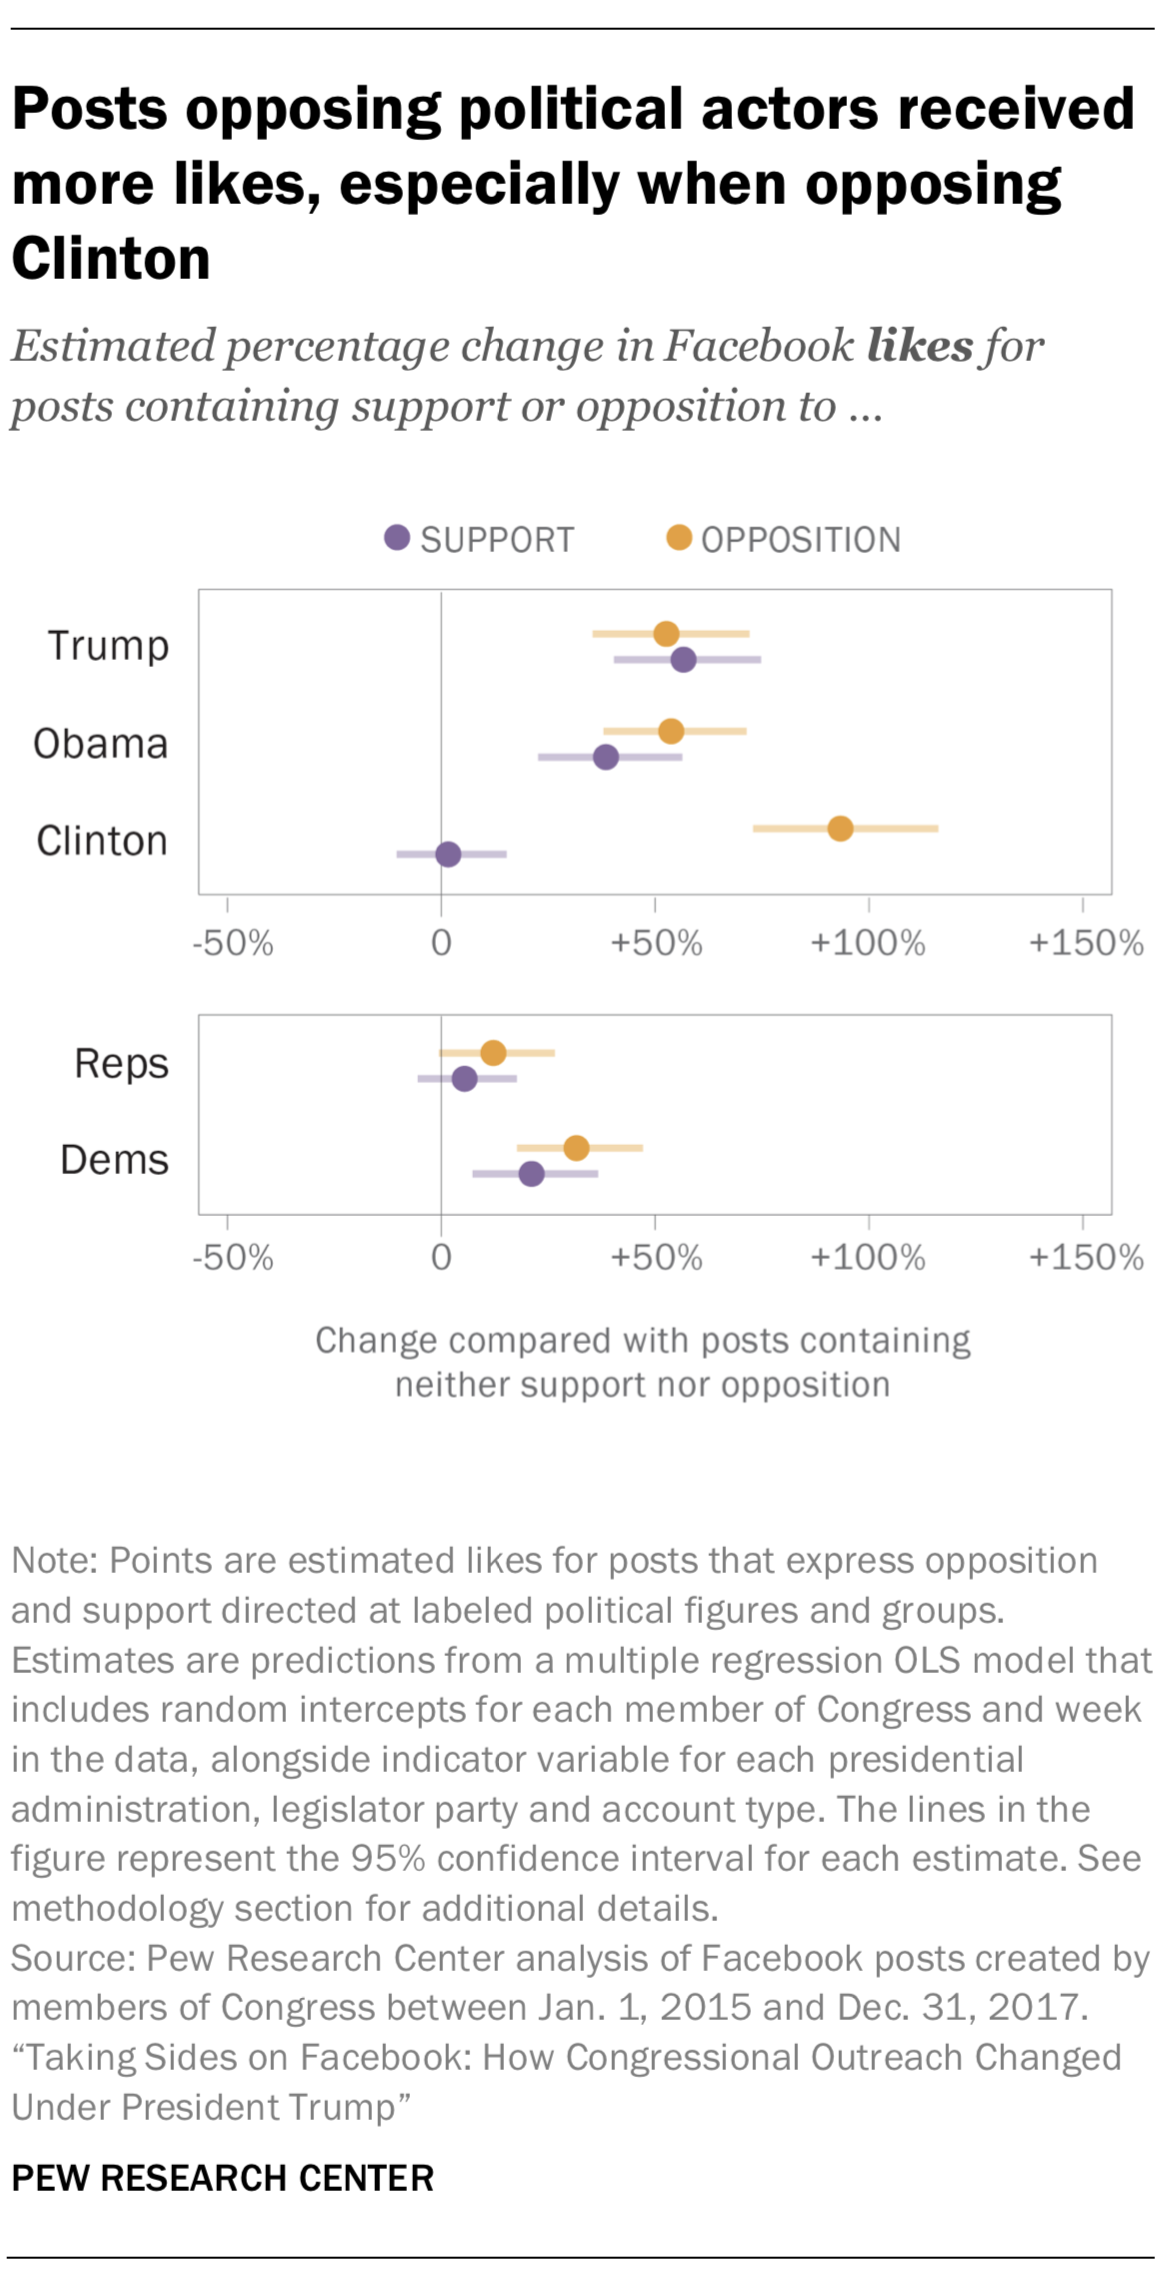
Posts opposing Presidents Trump and Obama and former Secretary Clinton drew more likes from Facebook audiences compared with posts that didn’t express political support or opposition. On average, posts opposing Trump received 53% more likes, posts opposing Obama received 54% more and posts opposing Clinton received 93% more likes. However, this pattern was more muted when posts opposed Democrats or Republicans more generally: Those posts received 32% and 12% more likes than posts that didn’t take sides. These findings parallel earlier research that examined the relationship between political disagreement and Facebook engagement.
 Among posts expressing political support, the results were less consistent. Posts supporting Trump, Obama and Democrats received an estimated boost in likes of 56%, 38% and 21%, respectively, relative to a post that did not contain any support or opposition. But the boost in likes for posts that supported Clinton or Republicans was much smaller: 2% and 5%, respectively.7
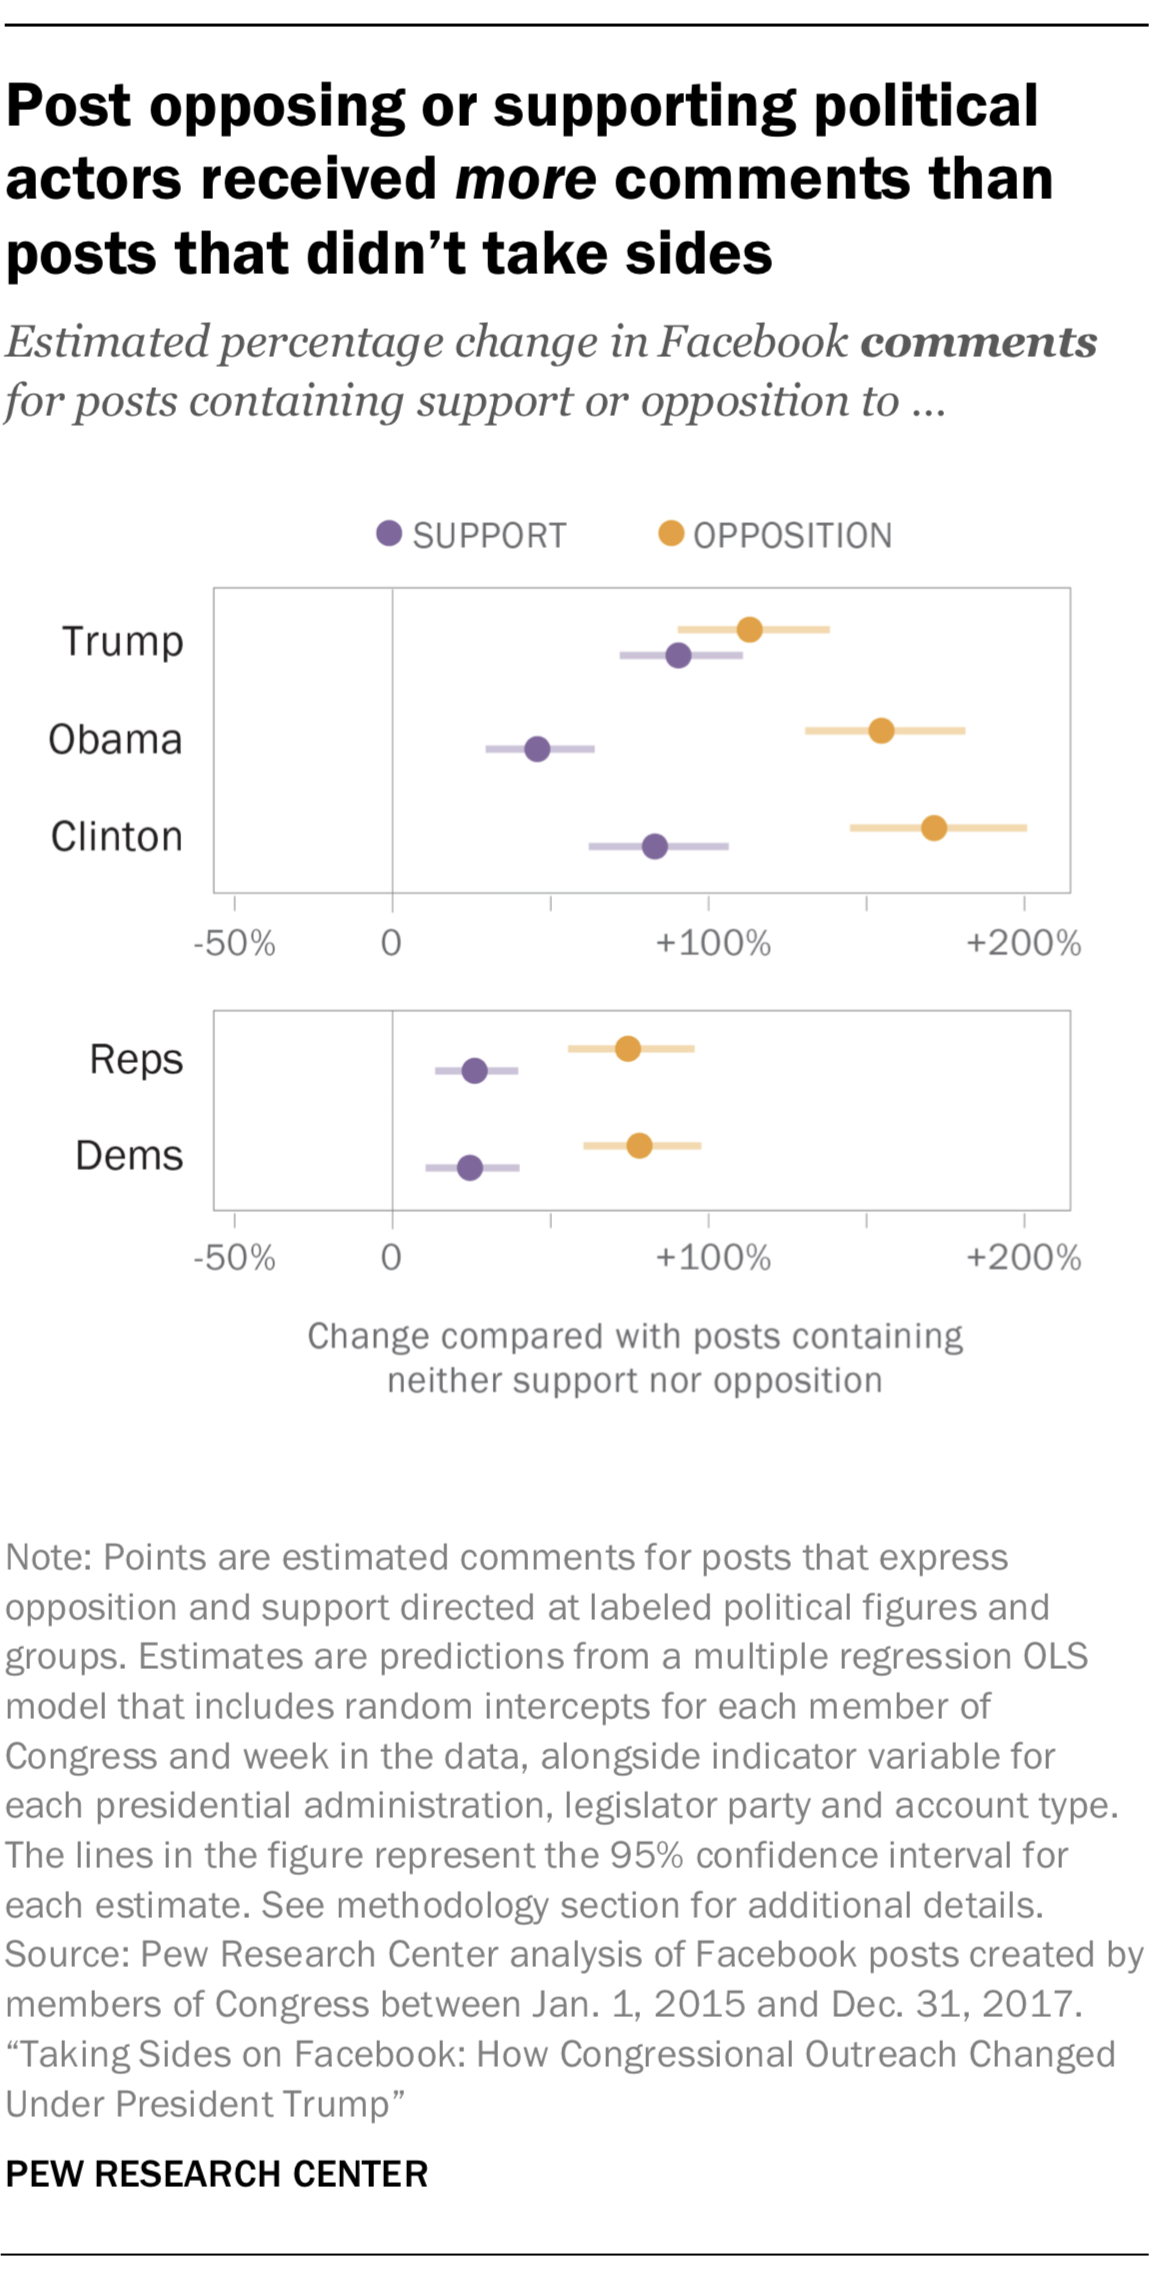
The Facebook audience was also more likely to leave comments on posts that expressed either support or opposition than on posts that did neither. When it came to comments, oppositional posts were consistently more likely to result in comments than posts that expressed support. Posts that opposed Clinton received the largest boost in comments, garnering 171% as many comments as the average post that did not express either support or opposition. Similarly, posts opposing Obama and Trump received 155% and 113% more comments. Posts expressing support for Trump, Obama and Clinton received boosts in comments of 90%, 46% and 83%, respectively. A similar but less pronounced pattern emerged for posts opposing and supporting the two political parties.
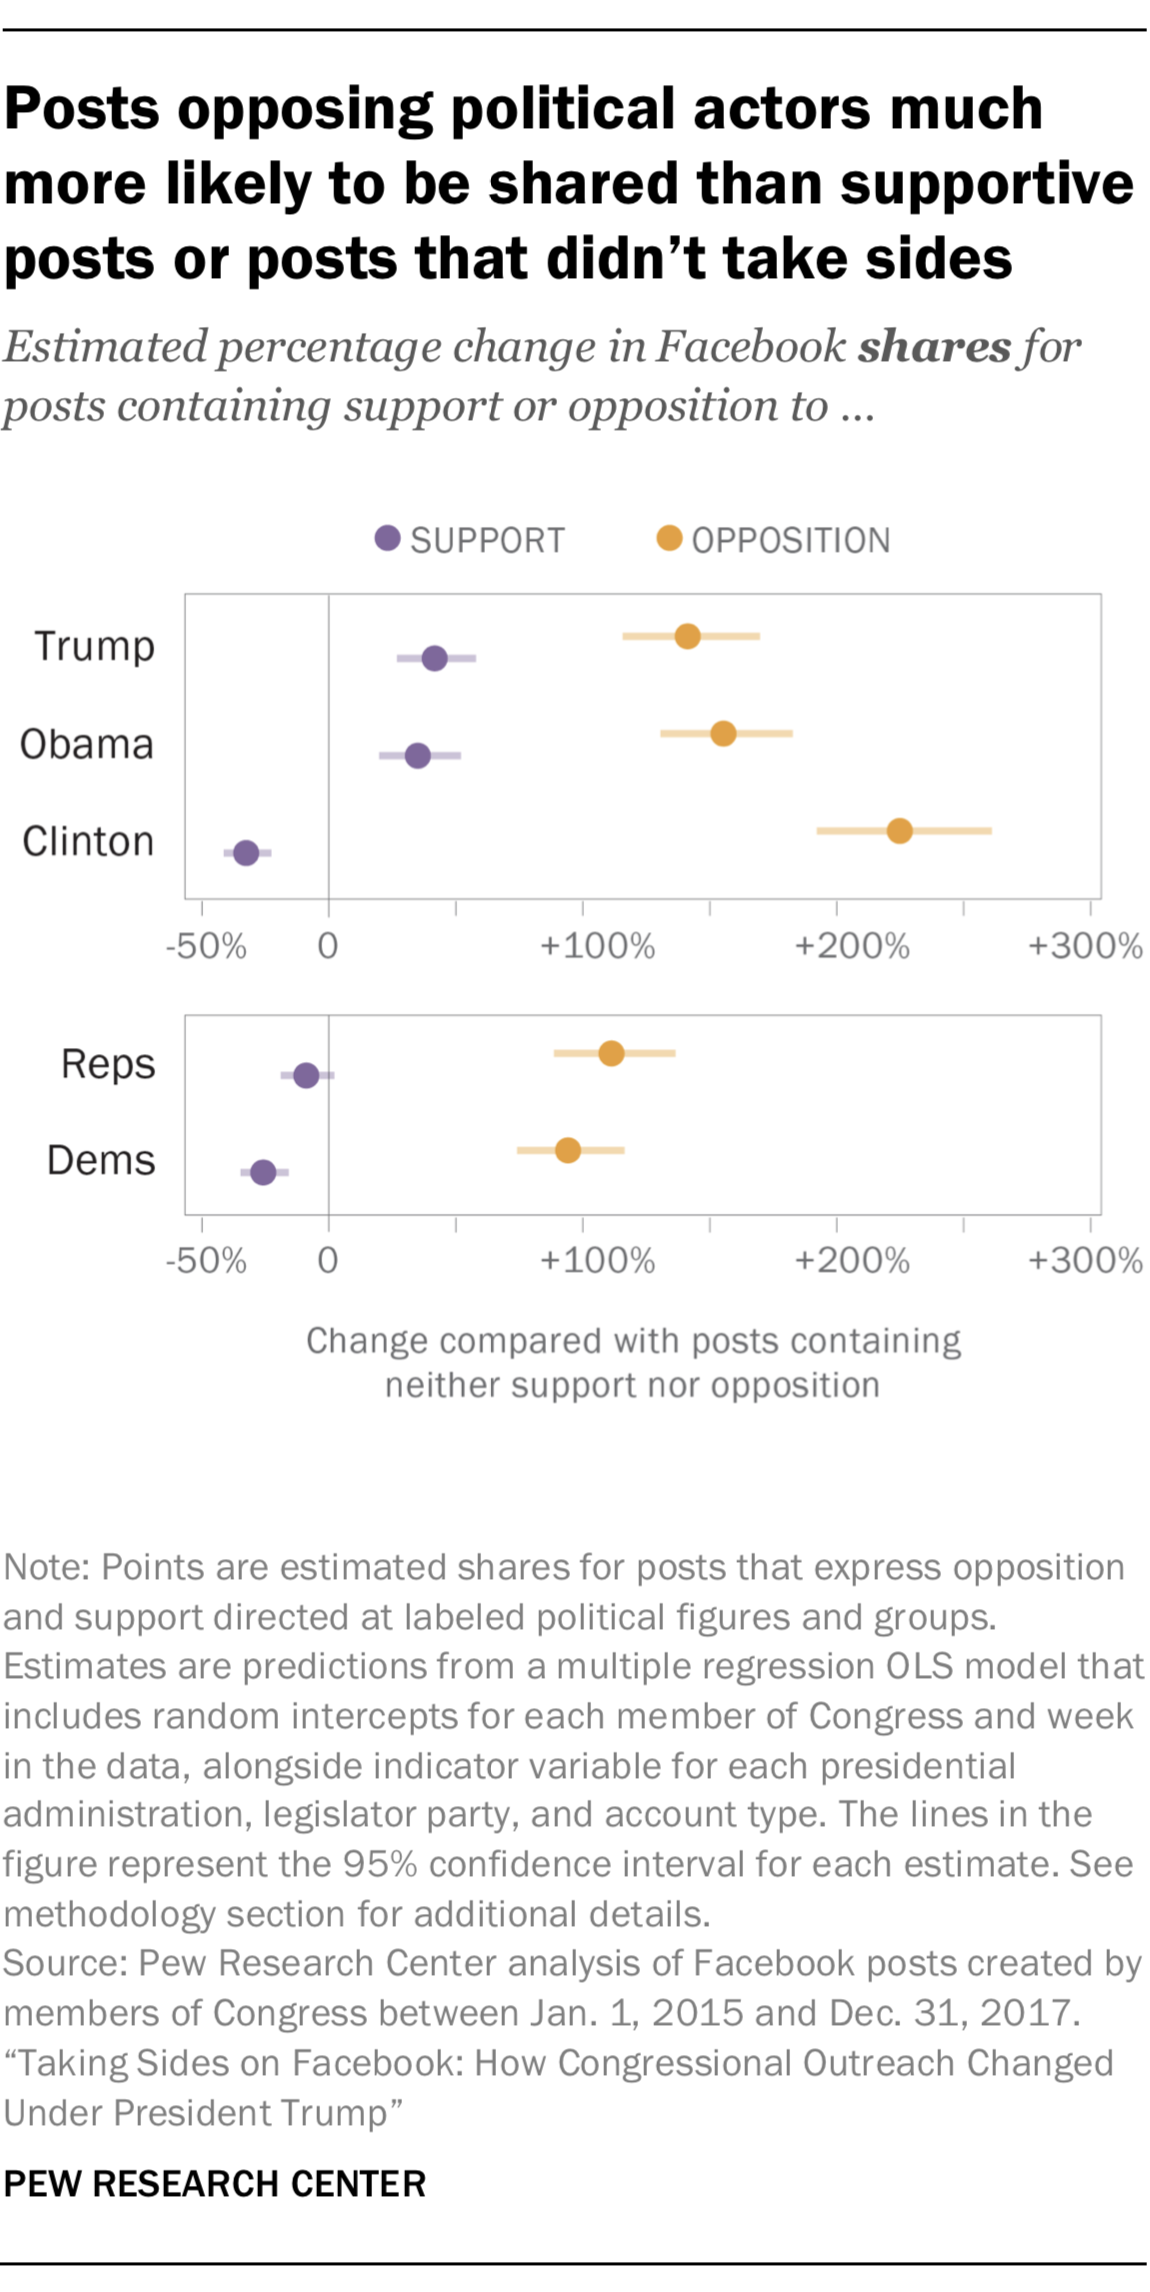 When it came to Facebook shares, which refer to users reposting congressional posts for their own Facebook audiences, the difference between posts expressing opposition and posts expressing support was most pronounced. Posts that opposed Trump, Obama and Clinton received an estimated boost in shares of 141%, 155% and 225%, respectively. However, posts that expressed support for Trump or Obama received smaller increases, of 41% and 35%. And posts that supported Clinton actually received fewer shares than posts that did not take sides; a decrease of 33%. Posts supporting Democrats and Republicans also received fewer shares than posts that didn’t take sides, decreasing 26% and 9% of shares, respectively.
Angry reactions from the Facebook audience increased; posts expressing opposition received most anger
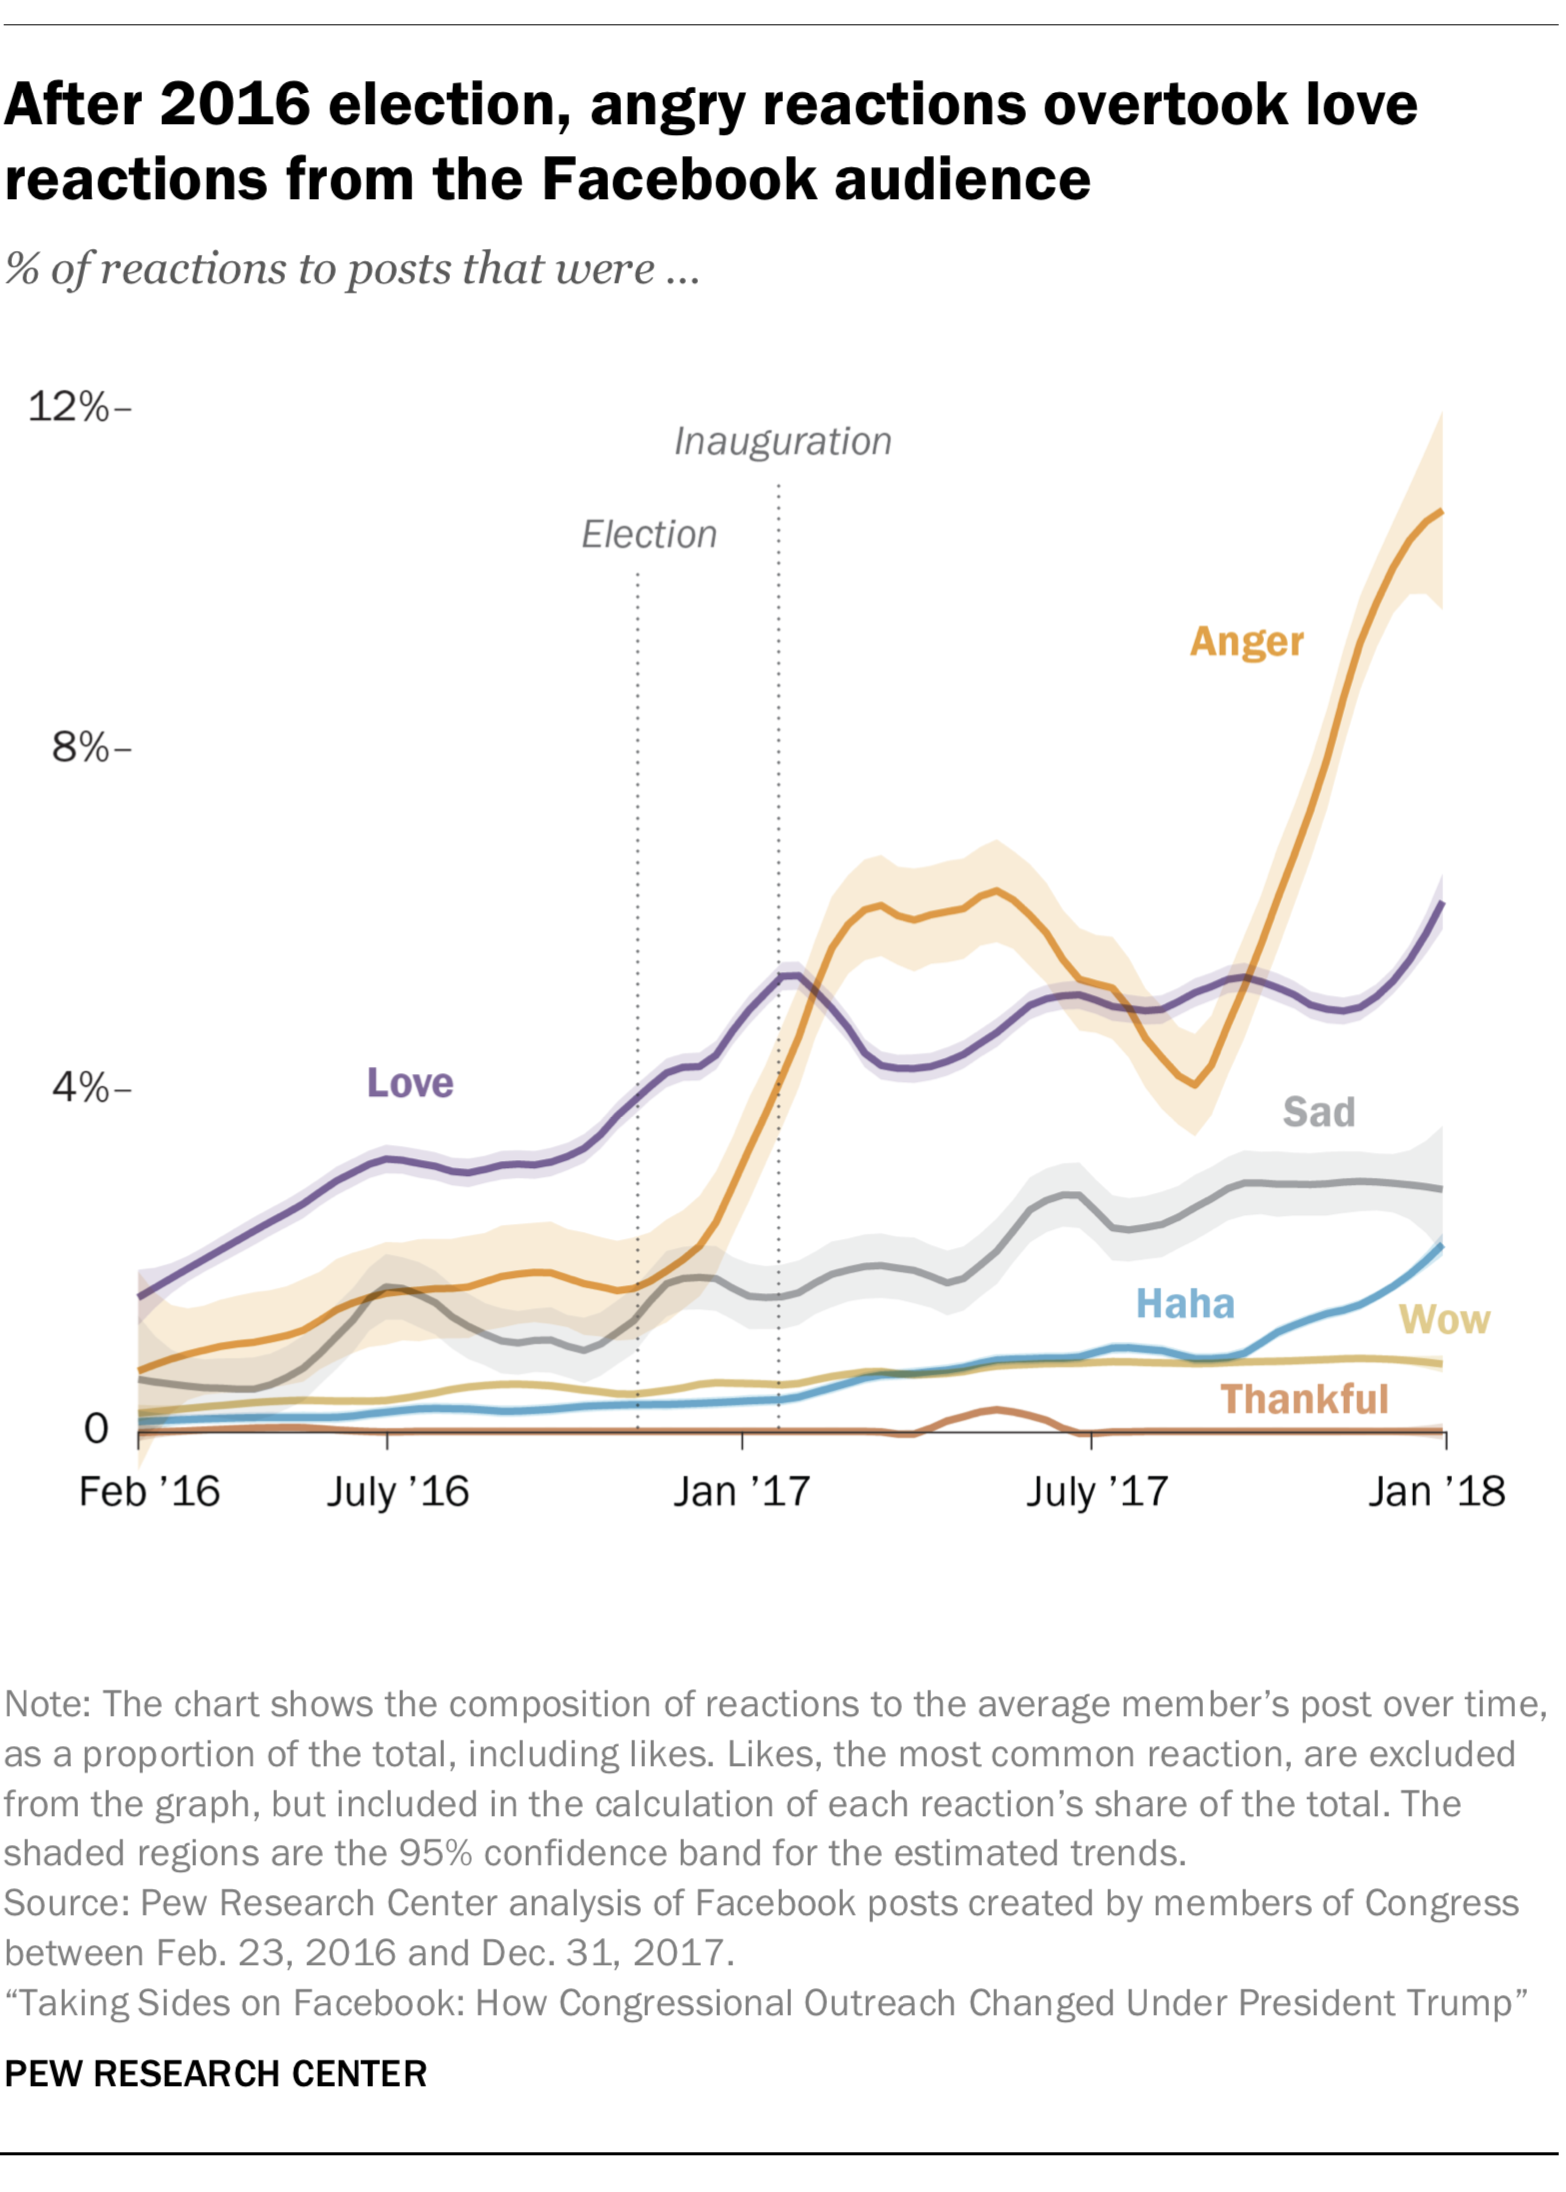 Legislators’ Facebook audiences became much more likely to react to posts with Facebook’s “angry” button in the wake of the 2016 election. Prior to the election (but after the “angry” feature was released), just 1% of all reactions to posts by Democrats were angry. After the election, that share increased to 5%, on average. Among Republicans, the share of angry reactions increased from 2% before the election to 6% after. While “likes” remain the most common reaction, “angry” was the most frequently used of the six alternatives (such as “haha,” “wow,” and “love”). This has not always been the case. Prior to Trump’s inauguration, the “love” reaction was the most commonly used alternative to “likes,” but it has since been largely eclipsed by “angry.” The use of angry reactions to congressional Facebook posts rose throughout 2017, reaching its highest observed rates at the end of the year, comprising 9% of all reactions to the average Democrat’s posts in December 2017, and 13% of the average Republican’s.
Angry reactions were especially likely to ensue when posts expressed political opposition. Posts that expressed opposition to Trump received an estimated five times as many angry reactions as posts that did not express support or opposition toward any figure or group. When Democrats expressed opposition to Republicans, they earned six times as many angry reactions, on average. Because the emotional reactions were not available across the entire timeframe, this analysis is based upon posts created between Feb. 23, 2016 (the day before the reactions were released) and Dec. 31, 2017.
Comments increased after Trump won 2016 election
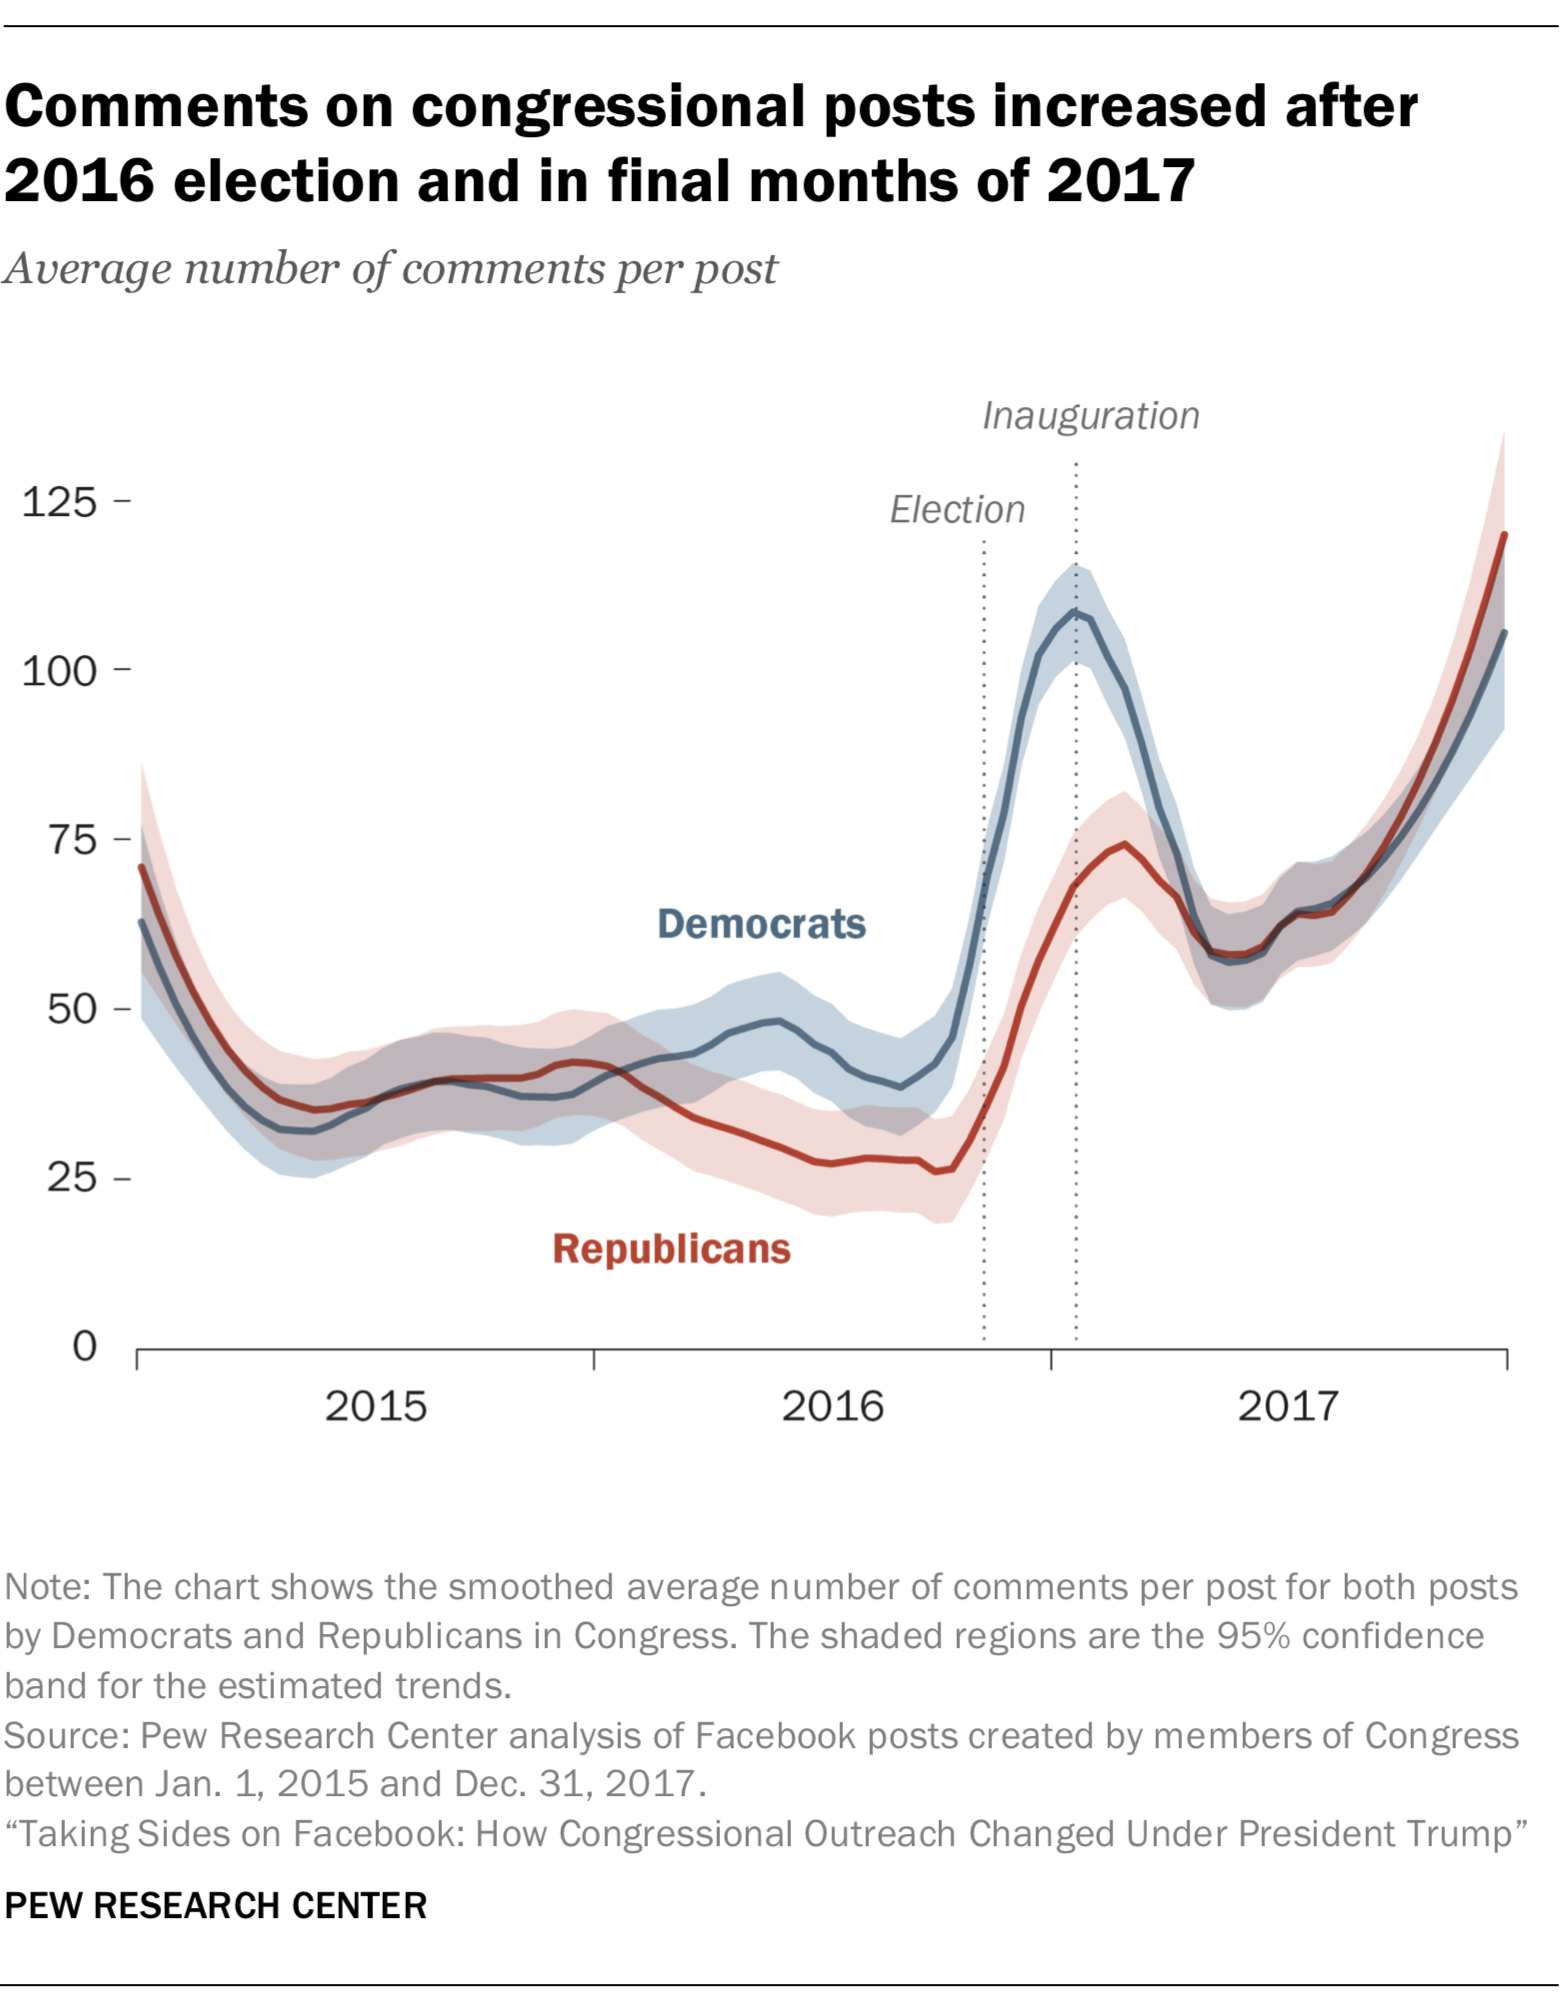 In the wake of the 2016 election, legislators’ Facebook audiences became much more likely to engage online by posting comments. Across both parties, the average number of comments per post increased more than 200%, comparing the time period before the 2016 election with all posts created afterward.
Just as the use of angry reactions peaked in December 2017, the Facebook audience became more likely to post comments at the end of that year, averaging 125 comments per post. By contrast, in December 2015, the average post received just 65 comments. This pattern is even more pronounced when examining the median number of comments per post. That number more than tripled, from seven comments per post at the end of 2015 to 22 comments by December 2017.


 Video: What is machine learning?