Within longer news articles, Center researchers were interested in learning how engaged time on cellphones varies across different news topics.
To study this, researchers manually coded the news topic for a random sample of 17% of articles 1,000 words or longer with at least one cellphone visit. That resulted in 3,118 articles and nearly 4 million complete interactions.10
We also separated the articles into those that are 1,000 to 4,999 words and those that are 5,000 or more, to help get a more refined sense of engaged time as the word length increases.
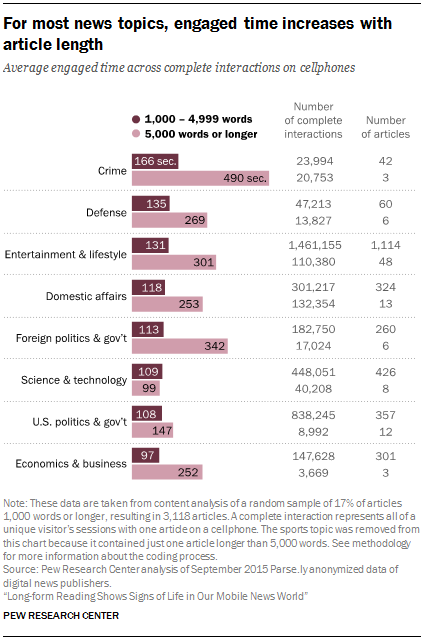
The findings suggest some differences in the time people spend with different news topics on their phones, including which topics continue to build engaged time as the story length increases beyond 5,000 words. (For some of these topics the total number of stories over 5,000 words is quite small, though in every case the number of complete cellphone interactions analyzed totals more than 3,000. Still, the findings should be considered in context and more suggestive than definitive. The accompanying chart includes both the number of stories and number of complete interactions for each topic at both the 1,000 to 4,999 and 5,000+ levels.)
Among long-form stories between 1,000 and 4,999 words, average engaged time on cellphones ranges from a low of 97 seconds for economic and business stories to a high of 166 seconds for crime stories – which in most cases went beyond the general recounting of a crime event to discuss the nuances or background of a case in greater detail.
What is more striking, though, is how that average engaged time either increases, declines or stays roughly the same as the word count grows. In other words, how long are cellphone readers willing to stick around as a story lengthens, and does this differ by topic?
Most topic areas see at least some uptick in time spent, though to varying degrees. Crime again stands out with the highest average engaged time. While there are just three stories in this sample – each of which used specific criminal cases as a lens to explore broader political issues like the death penalty – they drew more than 20,000 complete interactions which averaged longer than 8 minutes (490 seconds). Readers also devoted more time to especially long foreign politics stories, though to a lesser degree than readers of crime stories: An average of 342 seconds or just over five and a half minutes across the 17,000 interactions with six stories. And average time with entertainment stories, of which there were far more both in the 1,000-4,999 range (over 1,000) and in the 5,000+ range (48), more than doubled from 131 seconds to 300.
On the other hand, there were two topic areas that saw little if any rise in average time spent as stories went beyond 5,000 words: U.S. politics and science and technology. Readers of long-form U.S. politics stories under 5,000 words were already on the low end of engaged time compared with other topics areas: 108 seconds. Among those 5,000 words or more, the average time of the roughly 9,000 complete interactions increased to 147 seconds – far lower than for most other topics and even below the average time spent with long-form crime stories below 5,000 words. And science and technology stories actually saw the average time decrease as stories grew in length: 109 seconds for those articles that are 1,000-4,999 words and 99 seconds among those articles 5,000 words or longer, which tended to be less about the latest gadgets and more about placing science or technology in the broader political, social or economic environment.

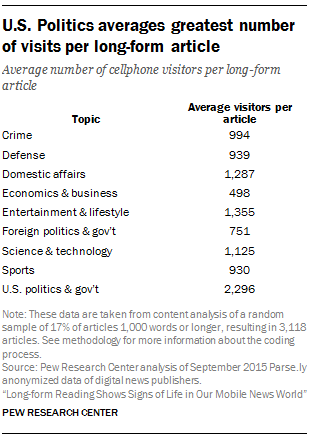
The data also reveal that the reach of a topic, or particular stories within a topic area, does not seem to be related to the level of engaged time spent with articles in this area. In this sample, for example, U.S. politics had the highest number of average cellphone visitors per article at 2,296, but is tied for the second lowest average engaged time at 108 seconds. At the same time, however, long-form economics & business articles, which had the lowest average engaged time, also had the lowest number of average visitors. For the remaining topic areas, the relationship of average engaged time and average visits per article falls in between.


