Over the last year, tablet ownership has steadily increased from 11% of U.S. adults in July of 2011 to 18% in January of 2012, according to PEJ data. Currently, 22% own a tablet and another 3% regularly use a tablet owned by someone else in the home. This number is very close to new data, released here for the first time, conducted in a separate survey by the Pew Internet & American Life Project on July 16 through August 7 2012 that found 25% of all U.S. adults have a tablet computer.
The growth in tablet adoption is likely related to the advent of the lower-priced tablets in late 2011. Overall, about two-thirds of tablet-owning adults, 68%, got their tablet in the last year, including 32% in 2012 alone.
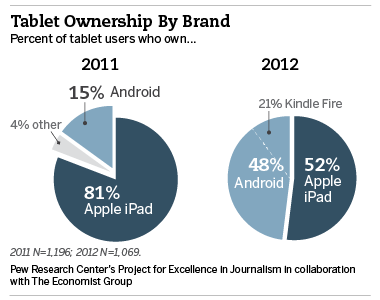
That has lessened Apple’s dominance in the market. Now, just over half, 52%, of tablet owners report owning an iPad, compared with 81% in the survey a year ago. Android-based devices make up the bulk of the remaining tablet ownership, 48% overall, dominated largely by the Kindle Fire. Two in ten, 21%, own a Kindle Fire, 8% the Samsung Galaxy, and the rest, a mix of others. (These numbers match very closely with sales data which put the Apple iPad at 61% of world sales, Android devices at 31% and Windows at 4%.)[1]
This survey was also conducted before the introduction of Google’s Nexus 7 or Amazon’s Kindle Fire HD.
Even before these, the influx of Android-based devices has changed the tablet market, much as it did for smartphones over the past several years. Of the 44% of adults who have a smartphone, 46% have an Android phone, 38% have an iPhone and 10% have a Blackberry.
Among those who have both a tablet and smartphone, there is some operating system loyalty. A majority of iPad owners who also have smartphones have an iPhone (57%); just 32% have an Android phone. Similarly, 66% of those who have an Android tablet have an Android phone; 29% have an iPhone.
Footnote:
[1] CBS News. "Worldwide Market Share for Tablet Systems." August 24, 2012.

 Infographic