Media Movers: 7% of the general population
A clear sense from this group is that they come across information nuggets – by themselves or from others – that they then pass along to others. Media Movers have a wide range of online habits, whether that means checking the news, searching for health care information, or buying something online. Many participate in group blogs or maintain their own web page, and they use their cell phones to text or snap a picture.
Media Movers do not see ICTs as key parts of their personal productivity, but as a way to keep in touch with family and friends. For them, these aren’t just email missives about what they are up to, but also the link to the article or video that members of this group think their social networks might enjoy. This might result in a call from a friend to their cell phone to chat about it, and Media Movers are more likely than not to welcome the intrusion.
Assets
This group rates second (behind Digital Collaborators) in the most number of information appliances. It has a relatively strong orientation to desktop computing, as 91% of Media Movers have one, a figure matched only by Digital Collaborators, and 46% have laptop computers. The figure for laptops trails prior groups significantly, as those groups have 78% and 65% laptop ownership, respectively. Media Movers also have a lot of picture-taking capacity; 87% have digital cameras and 66% have video cameras. Not surprisingly, nearly all have cell phones.
87% of Media Movers have a digital camera, and it is one device that helps them share information with other.
As to online experience, the typical Media Mover has been online for 10 years, which is right at the average, and 84% have home broadband connections.
Actions
Media Movers have a wide, if not particularly deep, portfolio of digital behaviors. Roughly one-third (31%) go online at home several times a day, which trails the average by 5 percentage points, and 34% do so from work, which also lags the average. When asked about a range of online activities that they have ever done, this group exceeds the average, but when focusing on activities done on the typical day, they are only on par with the entire sample of internet users.
Relative to their internet behavior, Media Movers are more involved with their cell phones. Some 57% in this group do at least one non-voice data action using their cell phone on the average day compared with the 36% figure for all cell users. They are active texters (45% send or receive a text message on the average day), and 31% have recorded video on their cell phone. That figure surpasses the 18% average for cell users and places this group at the top in terms of frequency of doing recording video with a cell phone.

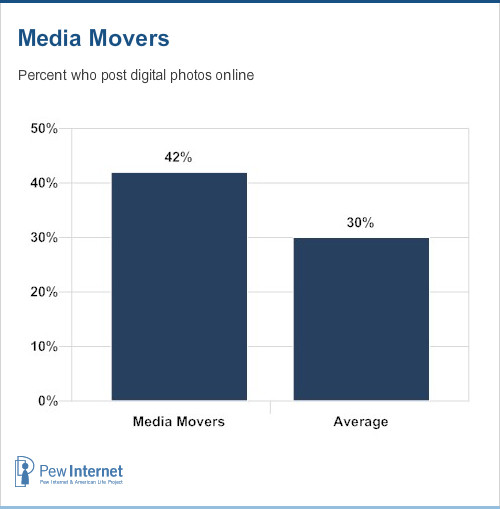
Some 58% of Media Movers say they take their own video (using whatever device), and this figure far exceeds the 22% average and is matched only by Digital Collaborators. They are also into digital photography; 81% take digital photos, with three-quarters sharing them over email and 31% posting them to the internet.
This group’s engagement with video and digital photography suggests they like to manage information online. For some, this can manifest itself in blogging (17% of this group say they have one) and through web pages. Some 24% of Media Movers have their own web page (against the 14% average and the second highest figure in the typology behind Digital Collaborators), and 21% work on group web pages or blogs, again the second-highest figure across typology groups.
Attitudes
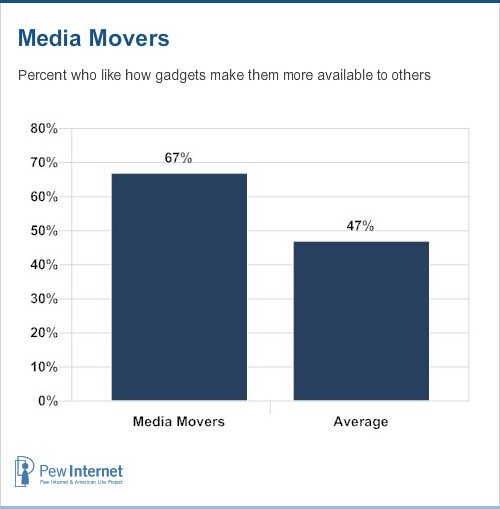
Media Movers are content with what ICTs do for them. Two-thirds (67%) like how cell phones and other gadgets make them more available to others, and three-quarters (74%) like how ICTs help them keep up with family and friends. Few (15%) need help in setting up their new information gadgets.

Yet this contentedness falls short of the enthusiasm about ICTs’ affordances expressed by some other groups. About half (49%) think ICTs grant more control over their lives, which is average but half the rate at which Digital Collaborators say this. A majority of Media Movers (53%) also say it is good to take a break from the internet, 11 points above the average.
As to which gadgets would be difficult to give up, the cell phone rates the highest for this group. Some 52% say they would find it very hard to give up their cell phone, a large gap over the internet (33%). Media Movers also have a notably large difference between the rate at which group members say it would be very hard to give up the internet (33%) versus email (17%). As active managers of digital content, this group has a greater attachment to the internet for those purposes than for a communication function such as email. And it could be that sharing content, which also often allows users to add a note of text to it, helps diminish the importance of email for Media Movers. For communicating with their social networks (and 46% of this group has an online social networking profile), the cell phone is likely the main tool.
Changes from last time
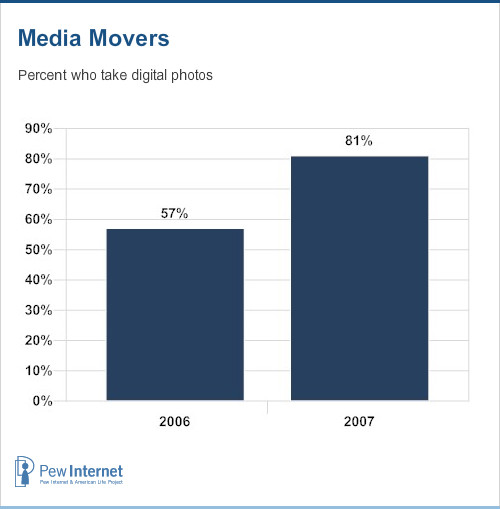
The callback survey yielded 75 respondents among Media Movers who were also contacted in 2006. This subsample showed a large increase in broadband adoption at home, from 63% to 88%, but not a commensurate increase in frequency of internet use at home. One-quarter (25%) of Media Movers went online at home several times a day in 2006, while 32% said this in 2007. Yet the growth in broadband adoption did yield some changes in information consumption. More Media Movers downloaded video in 2007 than 2006 (25% to 11%) and more paid for digital content online (27% to 16%). Three times as many in this group had watched TV programming on a non-TV device in 2007 than 2006 (24% to 8%). Finally, more Media Movers were taking digital photos in 2007 versus 2006, by a 81% to 57% margin.

In spite of these changes, the attitudes of Media Movers about information technology remain mixed. The share of those saying it would be hard to do without the internet stayed about the same (29% in 2006 and 31% in 2007) and in fact there was an increase in the share saying they suffered from information overload (from 25% to 32%). There was also a drop in the share of people saying that ICTs help them be more productive; 39% agreed a lot with this proposition in 2006 and 25% said this in 2007.
Only the mobile device fared well. Half (51%) of Media Movers in 2006 said they liked that devices such as the cell phone made them available to others; that number grew to 60% in 2007.
Demographics
The Media Movers group is the typology’s second youngest group of adults, with a median age of 34, and 56% are men. Beyond its youth and tilt toward males, it is demographically much like the general population of adults. Its racial composition basically mirrors the general population and this group has about the same share of college graduates as the entire sample (32% for Media Movers versus 29% for the sample).
Differences from the norm show up in income and family life. Because it has a lot of young people, group members are more likely to be parents of minors – 51%, compared to 33% for the sample. The group is also better off economically than the entire sample. Some 56% of Media Movers report household incomes over $50,000 per year, compared with the average of 39% for the sample. The group is the most heavily suburban of any group, with 55% living in the suburbs, and 70% are employed full time, the highest (along with Digital Collaborators) of any group.


