Digital Collaborators: 8% of the general population
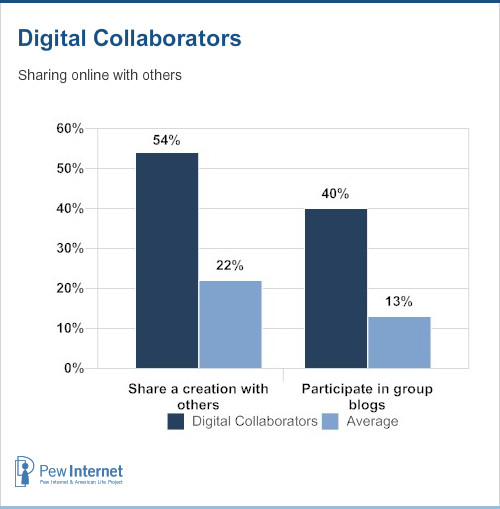
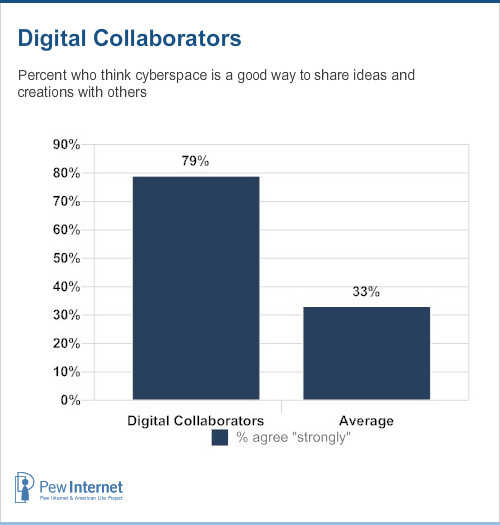
For this group, cyberspace is a place for group collaboration and shared creative effort. This group has the greatest number of information gadgets of any group, the widest scope of online activities, and the most frequent internet habits. All this connectivity helps them share something of themselves with others – often as part of a group, and often something they have created. By large margins, this group is most likely to participate in group blogs and most likely to share a personal creation using the internet. Indeed, Digital Collaborators strongly feel that ICTs are a great way to share their ideas and creation with the world.
Assets
Digital Collaborators have a wealth of technology to delve deeply into digital life. Nearly all have broadband at home and cell phones (96% in each case). Roughly three-quarters have laptops (78%) and MP3 players (71%). In addition to having a laptop and cell phone, most (91%) have a desktop computer as well. In fact, 69% have both a laptop and desktop at their disposal. Members of this group score highly on other measures of media tools. Fully 96% have digital cameras, 77% have video cameras, and 73% have digital video recorders.
More than three-quarters (78%) of Digital Collaborators have laptop computers, twice the average of 37%.
Another key asset is experience; this group has the most years of online experience, with the typical user saying he has been online for 12 years.
Actions
This group is heavily engaged with digital content – consuming it, but also sharing it with others and using it as a means for expression. The center of gravity for this deep relationship to digital content is the laptop computer with its ability to connect to the internet wirelessly. As noted, 78% of Digital Collaborators have laptop computers and 72% have used their laptop to go online wirelessly from someplace other than home or work.
As much as this group consumes digital content, it is also very distinct in what it does with digitized information. They create and share it at rates much higher than members of other groups. More than half (54%) of Digital Collaborators have shared some sort of creation with the world using the internet and the same number have posted a comment to a blog or website. One-quarter (27%) have blogs and 24% have taken online material and remixed into some other form. Some 44% have their own web page, and nearly one-fifth (18%) have created an online avatar or graphic image of themselves.

Handheld access forms another element of this group’s profile, although several other groups are equally as active in using a cell phone for non-voice applications. On a typical day, 59% of those in this group with cell phones do at least one of ten non-voice data applications, such as texting or taking a picture (a full list of non-voice data activities asked about can be found in the Appendix). For Digital Collaborators, handheld applications are oriented toward traditional information consumption and exchange. Members of this group are most likely among all adults on the average day to use their cell phone for email (18%) and accessing the internet for information (21%). And members of this group are most likely to have ever used their handheld to get directions or a map (29% have ever done this).
Another sign that this group is oriented to laptops and new media is its predilection for watching TV programming on non-TV devices. More than half (57%) of all Digital Collaborators have done this, against the average of 20%. Of this group, half (50%) have used a laptop to watch television programming. That is above the average of 39% for all those who watch TV on a device other than a traditional television set.
There is also ample evidence that this group uses digital content for entertainment and as a way to consume media traditionally delivered in other ways. Fully 82% of Digital Collaborators say they get some news online on the typical day and the same share (82%) has listened to radio online or using a device other than a traditional car or home radio. These figures set this group apart from others. Members of this group are also likely to play games online – 48% do. That is twice the average and similar to figures for two other groups.
Attitudes
This group’s active profile with respect to online content adds up to highly positive attitudes about information technology. Nearly all (94%) say information and communication technology (ICT) helps them learn new things and 95% say it helps them “a lot” to keep in touch with family and friends. Strong majorities say ICTs help them a lot to do their job (84%) and share their ideas or creations with others (79%).
When asked how hard it would be to give up different devices or services, 86% of this group said the internet would be “very hard” to do without. That is nearly twice the average (45%) for the sample and a dozen percentage points higher than any other group. This attachment to the internet has a lot to do with email; 81% of this group say they would find it very hard to give up email. Finally, some 61% of Digital Collaborators say they would find it “very hard” to do without their cell phone, which is above the average of 51% but on par or trailing several other groups in the typology. Just one-quarter (26%) say they would find it “very hard” to do without their landline telephone.

Digital Collaborators also are highly likely to believe ICTs give them more control in their lives and see them as a pathway to greater personal productivity. Fully 91% say they believe information technology helps them have more control over their lives, and 83% agree strongly that ICTs allow them to be more productive. Three-quarters (73%) like the extra availability that the internet and cell phones enable, and 55% strongly agree that it would be hard for them to get information without all their gadgets (twice the rate for the entire sample).
Finally, Digital Collaborators feel confident in their ability to deal with their gadgets and the quantity of information those gadgets deliver. Just 7% say they need help in setting up new gadgets, and only 12% say they feel overloaded by information.
Changes from last time
Of the 273 respondents in the 2007 survey that make up the Digital Collaborators group, 116 were contacted both the 2006 and 2007 surveys.
Most Digital Collaborators saw advances from already-high levels of gadget ownership; e.g., digital camera ownership increased from 90% to 98% and home broadband adoption grew from 86% to 97%. Ownership of MP3 players also rose, from 50% to 65%, as did ownership of laptop computers, from 69% to 77%.
These changes are associated with somewhat more frequent online use, as the share of re-contacted Digital Collaborators who say they use the internet several times a day rose from 59% to 65%.
The increases noted seem to suit Digital Collaborators just fine. The share saying they would find it very hard to do without the internet grew from 83% to 86% over the 20 months between surveys, and the share saying they like the extra availability brought about by ICTs increased from 65% to 73%. Fewer in the group reported suffering from information overload; just 6% said this in 2007 compared with 17% in 2006.
Demographics
This group has more males than females (56% are men) and the median age is 39. The group has a lot of online experience (about 12 years as noted above). It is both well-educated (61% are college graduates) and well-off (30% live in households with annual incomes over $100,000. The racial composition is close to that for all adults in the United States. Most (73%) are married, half (51%) have minor children in the home, and 70% are employed full time.
All in all, a typical Digital Collaborator fits the profile of a young adult, many married with children, and most putting their college degrees to work in the labor force. They earn more than the average American and have more than their share of ICTs at home or in their pockets.


