The COVID-19 pandemic, subsequent labor shortages and supply chain problems, a burst of inflation and new payment technologies have upended large swaths of the service economy – including the tipped sectors. And a large majority of Americans have perceived a shift in the nation’s tipping culture in recent years.

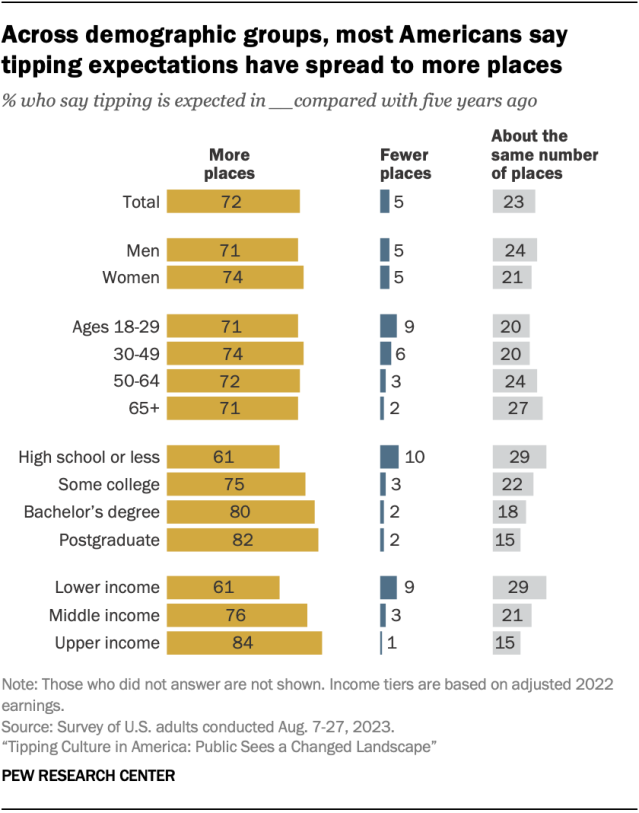
Overall, 72% of U.S. adults say tipping is expected in more places today than it was five years ago. Only 5% say it is expected in fewer places, while 23% say it’s expected in about the same number of places. Across demographic groups, majorities say tipping is expected in more places now compared with five years ago.
Whether Americans actually are tipping more frequently is difficult to say. There’s no official data on how many U.S. businesses rely on tips to compensate their workers or what share of workers are regularly tipped.1
There is, however, a widely reported perception that more businesses are at least offering customers the opportunity to tip workers. The adoption of point-of-sale tablets, apps and digital kiosks has made it easier for businesses to provide customers with tip prompts and suggestions.
Related: Do You Tip More or Less Than the Average American?
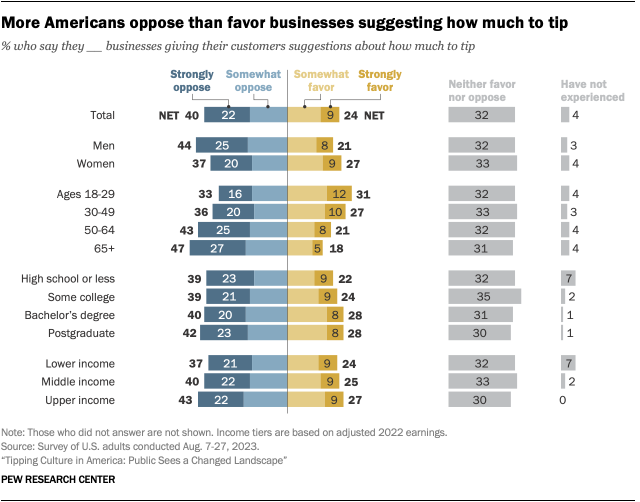
The public is more negative than positive about such automated tip suggestions, whether listed on a bill or shown on a screen when checking out. Four-in-ten U.S. adults strongly or somewhat oppose suggested tips, while 24% strongly or somewhat favor them and 32% neither oppose nor favor them. Attitudes differ somewhat by age and gender:
- Older Americans tend to feel most negatively about tip suggestions. Nearly half of people ages 65 and older (47%) strongly or somewhat oppose them. Adults under 30 are more split in their views: Roughly equal shares say they favor tip suggestions (31%), oppose them (33%), or neither favor nor oppose them (32%).
- Men are more likely than women to oppose suggested tip amounts: 44% of men strongly or somewhat oppose them, compared with 37% of women.

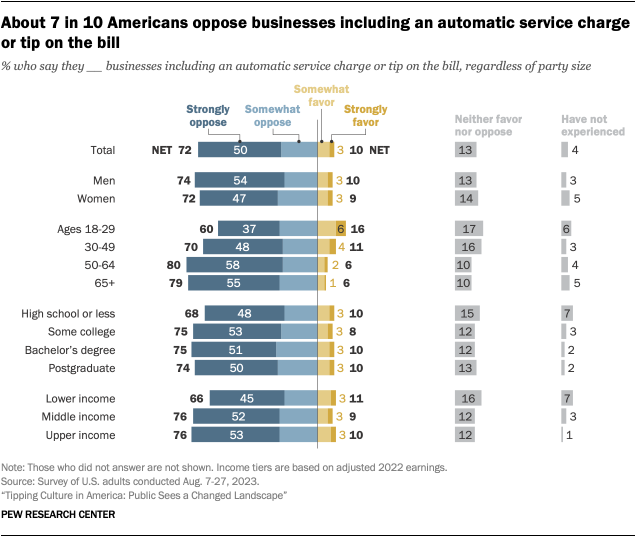
Feelings are much more negative when it comes to businesses – mostly restaurants – adding fixed-rate service charges to customers’ bills. Overall, 72% of U.S. adults strongly or somewhat oppose businesses including an automatic service charge or tip on the bill, while only 10% strongly or somewhat favor this. Another 13% neither oppose nor favor it.
Restaurants have imposed automatic service charges for years, but they typically did so only on larger parties. In recent years, particularly since the COVID-19 pandemic, more restaurants have begun imposing such charges – which now can sometimes exceed 20% of the check – on all customers.
Several reasons have been cited for the proliferating fees, including the desire to boost revenue without raising menu prices; slimmer profit margins due to higher costs for ingredients and supplies; and the need to pay higher wages – sometimes because of laws raising the local minimum wage, sometimes just to attract enough workers.
But service charges are distinct from tips, and not just because they’re mandatory. Since service charge revenue goes directly to the restaurant, in most cases the owners can use the money however they see fit. Despite the name, there’s generally no requirement that any of the money be distributed to workers.
Tips, on the other hand, are voluntary on the part of customers, who can determine whether and how much to give. Whether shared or not, tips must stay with the employees. By law, owners or managers cannot keep any tips. This is why some restaurants that impose service charges also include a tip option on the bill.
Across demographic groups, majorities of Americans say they oppose automatic service charges or tips on customers’ bills. But there are again some differences by age and income:
- Older adults are more likely than younger Americans to oppose automatic service charges or tips. About eight-in-ten (79%) of those ages 65 and older oppose such charges, compared with six-in-ten adults under 30.
- People with lower incomes are somewhat less likely than those with higher incomes to oppose automatic service charges or tips. Still, 66% of lower-income adults oppose such charges.


