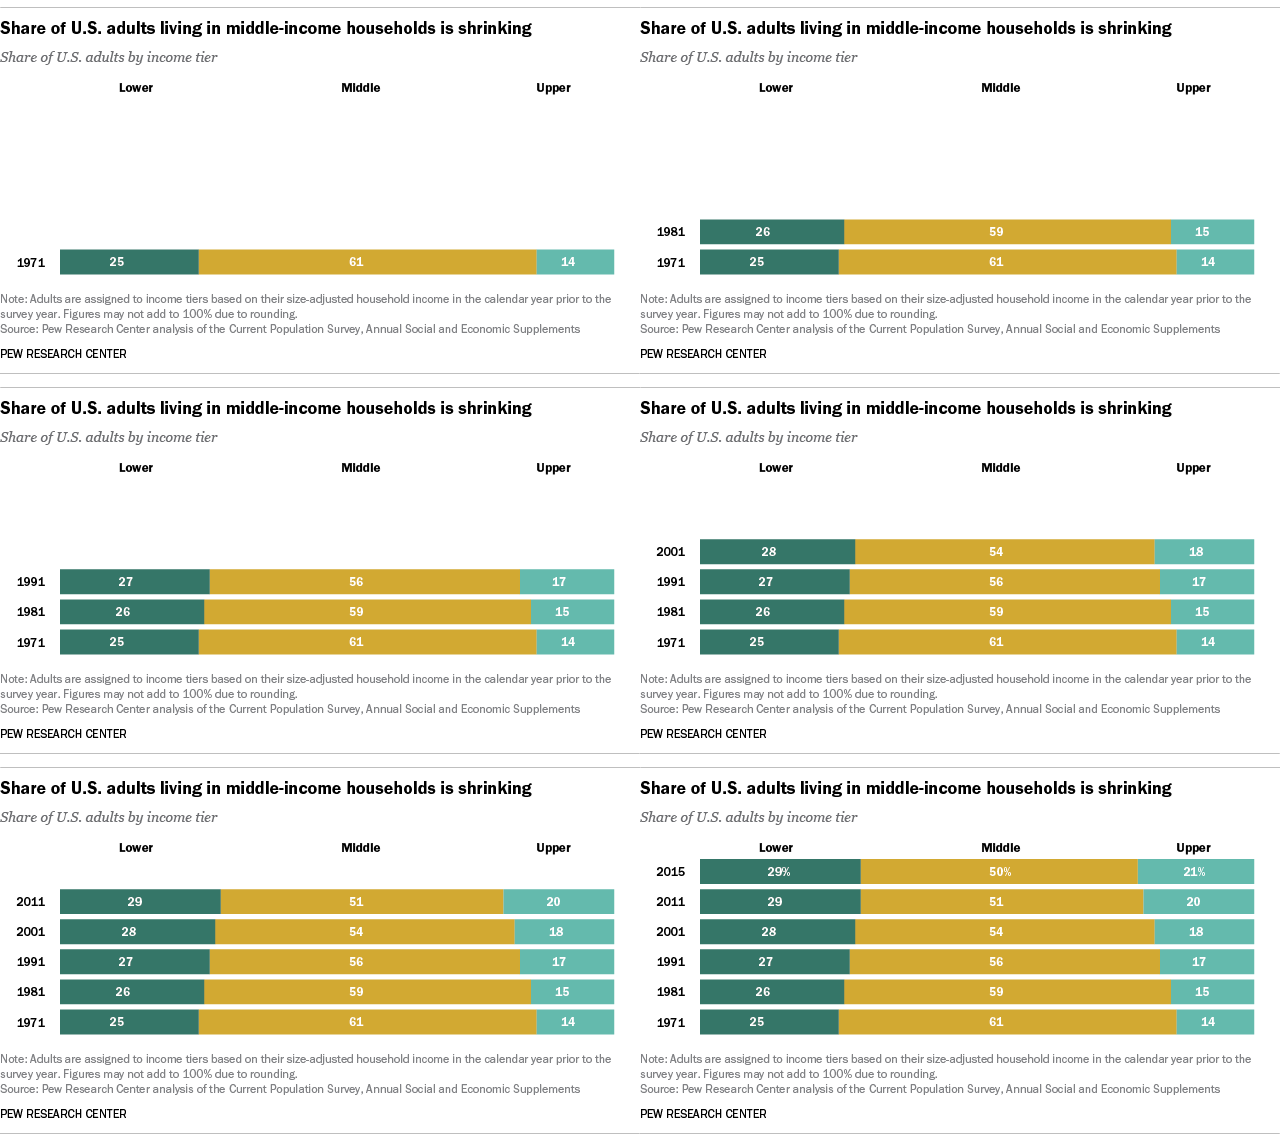
Americans in middle-income households have lost significant ground since 1970, according to a new Pew Research Center analysis of government data.
The middle class has long been the country’s economic majority, but our new analysis finds that’s no longer true. Meanwhile, the middle class has fallen further behind upper-income households financially, which now hold a larger share of aggregate household income than ever before in the 44-year period examined.

We define middle-income households as those whose annual household income is two-thirds to double the U.S. median household income after incomes have been adjusted for household size. This amounts to about $42,000 to $126,000 annually, in 2014 dollars and for a household of three. Lower-income households have incomes less than two-thirds of the median, while upper-income households have incomes that are more than double the median. (Related: Are you in the American middle class? Find out with our income calculator.)
Here are five key takeaways from the report:
1Middle-income Americans are no longer the nation’s economic majority. In early 2015, there were 120.8 million adults in middle-income households, matched in number by the 121.3 million adults who were in lower- and upper-income households combined.
This is the culmination of a long slide in which the share of adults in middle-income households has fallen from 61% in 1971 to 50% in 2015.
2The decline in the middle represents both economic progress and polarization. The shift shows progress in the sense that a larger share of Americans now live in upper-income households. Fully 21% of American adults in 2015 were upper income, compared with 14% in 1971, a 7-percentage-point increase. The increase in the share of upper-income adults was greater than the change in the opposite direction. Some 29% of U.S. adults were low income in 2015, compared with 25% in 1971.
But the data also show increasing economic polarization: As the distribution of adults thins in the middle, it is bulking up most at the extreme ends of the income distribution, the lowest and highest tiers.
3 Over the long haul, America’s middle-income households have seen their income grow. From 1970 to 2014, these households’ median income increased from $54,682 to $73,392 (in 2014 dollars), a gain of 34%. Lower-income household incomes have grown, too, but not as much: 28% over the same 44-year period. Upper-income household incomes have grown most, up 47% over this period.
However, the nation’s economic progress over the past several decades masks financial setbacks since 2000. Because of the recession in 2001 and the Great Recession of 2007-09, overall household incomes fell from 2000 to 2014. The greatest loss was felt by lower-income households, whose median income fell 9% over this period; the median for middle-income households fell 4%, and that for upper-income households fell 3%.
4The share of U.S. aggregate household income held by middle-income households has plunged, from 62% in 1970 to 43% in 2014. Meanwhile, the share held by upper-income households increased from 29% to 49%. This shift is driven both by the growing size of the upper-income tier and more rapid gains in income at the top.
There is also a growing disparity in the median wealth (assets minus debts) of these income tiers. Upper-income families, who had three times as much wealth as middle-income families in 1983, more than doubled the wealth gap to seven times as much in 2013.
5Over the years, certain demographic groups have fared better than others in moving up the economic ladder. Since 1971, older Americans (ages 65 and older) and African Americans have made notable progress in moving up the income tiers. But overall, both groups are still overrepresented in the lower-income tier. Married adults also made significant progress over this 44-year period, and women overall made greater economic gains than men.
Americans without a college degree stand out as experiencing a substantial loss in economic status since 1971, as do young adults ages 18 to 29. Hispanics overall are also more likely to be in lower-income households than in 1971, a change driven by the increasing share of immigrants in the Hispanic population in the past four decades.


