 After more than four decades of serving as the nation’s economic majority, the American middle class is now matched in number by those in the economic tiers above and below it. In early 2015, 120.8 million adults were in middle-income households, compared with 121.3 million in lower- and upper-income households combined, a demographic shift that could signal a tipping point, according to a new Pew Research Center analysis of government data.1
In at least one sense, the shift represents economic progress: While the share of U.S. adults living in both upper- and lower-income households rose alongside the declining share in the middle from 1971 to 2015, the share in the upper-income tier grew more.
Over the same period, however, the nation’s aggregate household income has substantially shifted from middle-income to upper-income households, driven by the growing size of the upper-income tier and more rapid gains in income at the top. Fully 49% of U.S. aggregate income went to upper-income households in 2014, up from 29% in 1970. The share accruing to middle-income households was 43% in 2014, down substantially from 62% in 1970.2
And middle-income Americans have fallen further behind financially in the new century. In 2014, the median income of these households was 4% less than in 2000. Moreover, because of the housing market crisis and the Great Recession of 2007-09, their median wealth (assets minus debts) fell by 28% from 2001 to 2013.
Meanwhile, the far edges of the income spectrum have shown the most growth. In 2015, 20% of American adults were in the lowest-income tier, up from 16% in 1971. On the opposite side, 9% are in the highest-income tier, more than double the 4% share in 1971. At the same time, the shares of adults in the lower-middle or upper-middle income tiers were nearly unchanged.
These findings emerge from a new Pew Research Center analysis of data from the U.S. Census Bureau and the Federal Reserve Board of Governors. In this study, which examines the changing size, demographic composition and economic fortunes of the American middle class, “middle-income” Americans are defined as adults whose annual household income is two-thirds to double the national median, about $42,000 to $126,000 annually in 2014 dollars for a household of three.3 Under this definition, the middle class made up 50% of the U.S. adult population in 2015, down from 61% in 1971.

Are you in the American middle class?
Find out with our income calculator.
Our new calculator allows you to see which group you fit in, first compared with all American adults, and then compared with other adults similar to you in education, age, race or ethnicity, and marital status.
The state of the American middle class is at the heart of the economic platforms of many presidential candidates ahead of the 2016 election. Policymakers are engaged in debates about the need to raise the floor on wages and on how best to curb rising income inequality. Meanwhile, President Barack Obama uses the term “middle-class economics” to describe his economic agenda.4 And a flurry of new research points to the potential of a larger middle class to provide the economic boost sought by many advanced economies.5
The news regarding the American middle class is not all bad. Although the middle class has not kept pace with upper-income households, its median income, adjusted for household size, has risen over the long haul, increasing 34% since 1970. That is not as strong as the 47% increase in income for upper-income households, though it is greater than the 28% increase among lower-income households.6
Moreover, some demographic groups have fared better than others in moving up the income tiers, while some groups have slipped down the ladder. The groups making notable progress include older Americans, married couples and blacks. Despite this progress, older Americans and blacks remain more likely to be lower income and less likely to be upper income than adults overall. Those Americans without a college degree stand out as experiencing a substantial loss in economic status.
In addition to changes in the size and economic standing of the American middle class, its demographic profile has changed significantly in recent decades. Some of the changes reflect long-term demographic trends in the U.S., as the middle class is in many ways a mirror of the broader population. For example, the aging of the country, the growing racial and ethnic diversity, the decline in marriage rates and the overall rise in educational attainment are all reflected in the changing composition of the middle class.
Who is middle income?
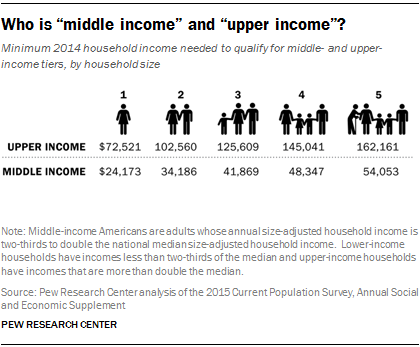 In this report, “middle-income” households are defined as those with an income that is 67% to 200% (two-thirds to double) of the overall median household income, after incomes have been adjusted for household size.7 Lower-income households have incomes less than 67% of the median, and upper-income households have incomes that are more than double the median.
The income it takes to be middle income varies by household size, with smaller households requiring less to support the same lifestyle as larger households. For a three-person household, the middle-income range was about $42,000 to $126,000 annually in 2014. However, a one-person household needed only about $24,000 to $73,000 to be middle income. For a five-person household to be considered middle income, its 2014 income had to range from $54,000 to $162,000.8
In addition, the lower-income group is divided into lowest-income households (with income less than half of the overall median) and lower-middle income households (with incomes from half to less than two-thirds of the overall median). In 2014, a lowest-income household with three people lived on about $31,000 or less, and a lower-middle income household lived on about $31,000 to $42,000.9
Likewise, upper-income households are divided into upper-middle income households (with more than twice the overall median income and up to three times the median) and highest-income households (with more than three times the overall median income). In 2014, an upper-middle income household with three people lived on about $126,000 to $188,000, and a highest-income household lived on more than $188,000.
Middle income or middle class?
The terms “middle income” and “middle class” are often used interchangeably. This is especially true among economists who typically define the middle class in terms of income or consumption. But being middle class can connote more than income, be it a college education, white-collar work, economic security, owning a home, or having certain social and political values. Class could also be a state of mind, that is, it could be a matter of self-identification (Pew Research Center, 2008, 2012). The interplay among these many factors is examined in studies by Hout (2007) and Savage et al. (2013), among others.
This report uses household income to group people. For that reason, the term “middle income” is used more often than not. However, “middle class” is also used at times for the sake of exposition.
The middle class shrinks
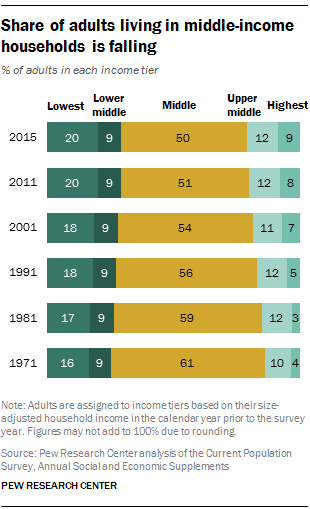 The hollowing of the American middle class has proceeded steadily for more than four decades. Since 1971, each decade has ended with a smaller share of adults living in middle-income households than at the beginning of the decade, and no single decade stands out as having triggered or hastened the decline in the middle.
Based on the definition used in this report, the share of American adults living in middle-income households has fallen from 61% in 1971 to 50% in 2015. The share living in the upper-income tier rose from 14% to 21% over the same period. Meanwhile, the share in the lower-income tier increased from 25% to 29%. Notably, the 7 percentage point increase in the share at the top is nearly double the 4 percentage point increase at the bottom.
The rising share of adults in the lower- and upper-income tiers is at the farthest points of the income distribution, distant from the vicinity of the middle. The share of American adults in the lowest-income tier rose from 16% in 1971 to 20% in 2015. Over the same period, the share of American adults in lower-middle income households did not change, holding at 9%.
The growth at the top is similarly skewed. The share of adults in highest-income households more than doubled, from 4% in 1971 to 9% in 2015. But the increase in the share in upper-middle income households was modest, rising from 10% to 12%. Thus, the closer look at the shift out of the middle reveals that a deeper polarization is underway in the American economy.
The middle class falls further behind upper-income households financially
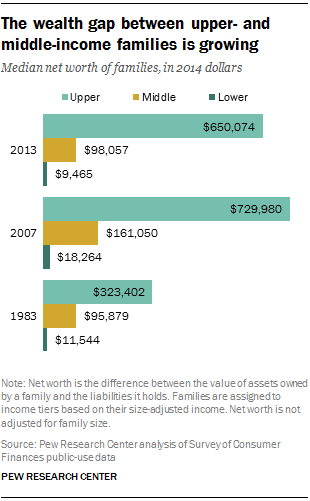
 The gaps in income and wealth between middle- and upper-income households widened substantially in the past three to four decades. As noted, one result is that the share of U.S. aggregate household income held by upper-income households climbed sharply, from 29% in 1970 to 49% in 2014.10 More recently, upper-income families, which had three times as much wealth as middle-income families in 1983, more than doubled the wealth gap; by 2013, they had seven times as much wealth as middle-income families.
Trends in income
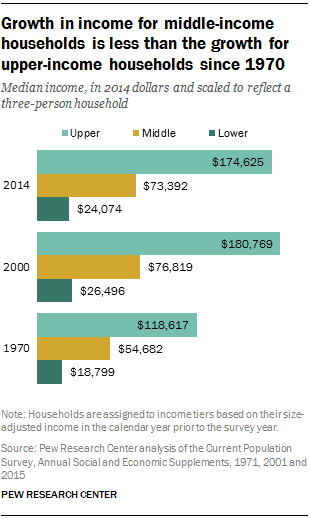
Households in all income tiers experienced gains in income from 1970 to 2014. But the gains for middle- and lower-income households lagged behind the gains for upper-income households.
The median income of upper-income households increased from $118,617 in 1970 to $174,625 in 2014, or by 47%. That was significantly greater than the 34% gain for middle-income households, whose median income rose from $54,682 to $73,392. Lower-income households fell behind even more as their median income increased by only 28% over this period.
Although 2014 incomes are generally higher than in 1970, all households experienced a lengthy period of decline in the 21st century thanks to the 2001 recession and the Great Recession of 2007-09. The greatest loss was felt by lower-income households, whose median income fell 9% from 2000 to 2014, followed by a 4% loss for middle-income households and a 3% loss for upper-income households.
Trends in wealth
 The Great Recession of 2007-09, which caused the latest downturn in incomes, had an even greater impact on the wealth (assets minus debts) of families. The losses were so large that only upper-income families realized notable gains in wealth over the span of 30 years from 1983 to 2013 (the period for which data on wealth are available).11
Before the onset of the Great Recession, the median wealth of middle-income families increased from $95,879 in 1983 to $161,050 in 2007, a gain of 68%. But the economic downturn eliminated that gain almost entirely. By 2010, the median wealth of middle-income families had fallen to about $98,000, where it still stood in 2013.
Upper-income families more than doubled their wealth from 1983 to 2007 as it climbed from $323,402 to $729,980. Despite losses during the recession, these families recovered somewhat since 2010 and had a median wealth of $650,074 in 2013, about double their wealth in 1983.
The disparate trends in the wealth of middle-income and upper-income families are due to the fact that housing assumes a greater role in the portfolios of middle-income families. The crash in the housing market that preceded the Great Recession was more severe and of longer duration than the turmoil in the stock market. Thus, the portfolios of upper-income families performed better than the portfolios of middle-income families from 2007 to 2013. When all is said and done, upper-income families, which had three times as much wealth as middle-income families in 1983, had seven times as much in 2013.
Demographic winners and losers
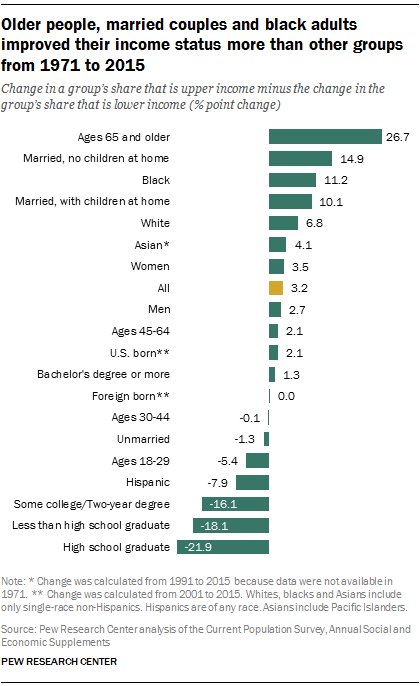 As the middle has hollowed, some demographic groups have been more likely to advance up the income tiers (winners) while others were more likely to retreat down the economic ladder (losers).
Nationally, the share of adults in the upper-income tier increased from 14% in 1971 to 21% in 2015, a gain of 7 percentage points. Meanwhile, the share of adults in the lower-income tier also rose, from 25% to 29%, an increase of 4 percentage points. The difference – 3 percentage points – is the net gain for American adults. By the same measure, the net gain in economic status varied across demographic groups.12
The biggest winners since 1971 are people 65 and older. This age group was the only one that had a smaller share in the lower-income tier in 2015 than in 1971. Not coincidentally, the poverty rate among people 65 and older fell from 24.6% in 1970 to 10% in 2014.13 Evidence shows that rising Social Security benefits have played a key role in improving the economic status of older adults.14 The youngest adults, ages 18 to 29, are among the notable losers with a significant rise in their share in the lower-income tiers.
The economic status of adults with a bachelor’s degree changed little from 1971 to 2015, meaning that similar shares of these adults were lower-, middle- or upper-income in those two years. Those without a bachelor’s degree tumbled down the income tiers, however. Among the various demographic groups examined, adults with no more than a high school diploma lost the most ground economically.
Winners also include married adults, especially couples where both work. On the flip side, being unmarried is associated with an economic loss. This coincides with a period in which marriage overall is on the decline but is increasingly linked to higher educational attainment.
Gains for women edged out gains for men, a reflection of their streaming into the labor force in greater numbers in the past four decades, their educational attainment rising faster than among men, and the narrowing of the gender wage gap.15
Among racial and ethnic groups, blacks and whites came out winners, but Hispanics slipped down the ladder. Although blacks advanced in income status, they are still more likely to be lower income and less likely to be upper income than whites or adults overall. For Hispanics, the overall loss in income status reflects the rising share of lower-earning immigrants in the adult population, from 29% in 1970 to 49% in 2015. Considered separately, both U.S.-born and foreign-born Hispanics edged up the economic tiers.
Road map to the report
This report divides households into three income tiers – lower income, middle income and upper income – depending on how their income compares with overall median household income. The analysis focuses on changes in the size and demographic composition of the three income tiers and on trends in their economic wellbeing. Unless otherwise noted, incomes are adjusted for household size and scaled to reflect a household size of three.
Households that are in the lower-, middle- or upper-income tier in one year are compared with households that are in one of those tiers in another year. The analysis does not follow the same households over time, and some households that were middle income in one year, say, may have moved to a different tier in a later year. The demographic composition of each income tier may also have changed from one year to the next.
The next section of the report describes the size of the U.S. adult population in each income tier and analyzes how it changed from 1971 to 2015. The lower- and upper-income tiers are also subdivided into two tiers each for a closer examination of the dispersion of the adult population: lowest income, lower-middle income, upper-middle income and highest income.
The report then turns to a demographic analysis of the three main income tiers. First, the report examines how changes in the size of lower-, middle- and upper-income tiers have played out differently across demographic groups. The key demographic breaks include age, marital status, gender, race and ethnicity, nativity, education, occupation and industry. Next, the report briefly examines the demographic composition of the middle-income population and how it compares with the population of adults overall and adults in lower- and upper-income tiers.
The final two sections of the report focus on the economic wellbeing of middle-income households, including how it has changed over time and how it compares with the wellbeing of lower- and upper-income households. The first of these two sections examines trends in household income and the second focuses on family wealth, assets and debts.
“Middle-income” households are defined as those with an income that is two-thirds to double that of the U.S. median household income, after incomes have been adjusted for household size. For a three-person household, the middle-income range was about $42,000 to $126,000 annually in 2014 (in 2014 dollars). Lower-income households have incomes less than two-thirds of the median, and upper-income households have incomes that are more than double the median.
Unless otherwise noted, incomes are adjusted for household size and scaled to reflect a household size of three. Adults are placed into income tiers based on their household income in the calendar year previous to the survey year. Thus, the income data in the report refer to the 1970-2014 period, and the demographic data from the same survey refer to the 1971-2015 period.
Whites, blacks and Asians include only the single-race, non-Hispanic component of those groups. Hispanics are of any race. Asians include Pacific Islanders. Other racial/ethnic groups are included in all totals but are not shown separately.
Adults with a high school education are those who have obtained a high school diploma or its equivalent, such as a General Educational Development (GED) certificate. Adults with “some college” education comprise those completing associate degrees as well as those completing any college at all, including less than one year. Prior to 1990, adults “with at least a college degree” refer to those who completed at least four years of college.
“Unmarried” includes “married, spouse absent,” never married, divorced, separated and widowed. “Married” includes opposite-sex couples only, because trends are not available for same-sex couples. “With children at home” includes adults with at least one biological, adopted or step child of any age in the household.
“Foreign born” refers to people born outside of the United States, Puerto Rico or other U.S. territories to parents neither of whom was a U.S. citizen, regardless of legal status. The terms “foreign born” and “immigrant” are used interchangeably in this report.
“U.S. born” refers to individuals who are U.S. citizens at birth, including people born in the United States, Puerto Rico or other U.S. territories, as well as those born elsewhere to parents who were U.S. citizens.


 Interactive Are you in the American middle class?