Most U.S. adults say tipping is expected in more places these days, but for many the rules are unclear

Pew Research Center conducted this study to explore Americans’ views of tipping and tipping culture, as well as their tipping practices in a variety of settings. For this analysis, we surveyed 11,945 U.S. adults from Aug. 7 to Aug. 27, 2023.
Everyone who took part in the survey is a member of the Center’s American Trends Panel (ATP), an online survey panel that is recruited through national, random sampling of residential addresses. This way, nearly all U.S. adults have a chance of selection. The survey is weighted to be representative of the U.S. adult population by gender, race, ethnicity, partisan affiliation, education and other categories. Read more about the ATP’s methodology.
Here are the questions used for this report, along with responses, and its methodology.
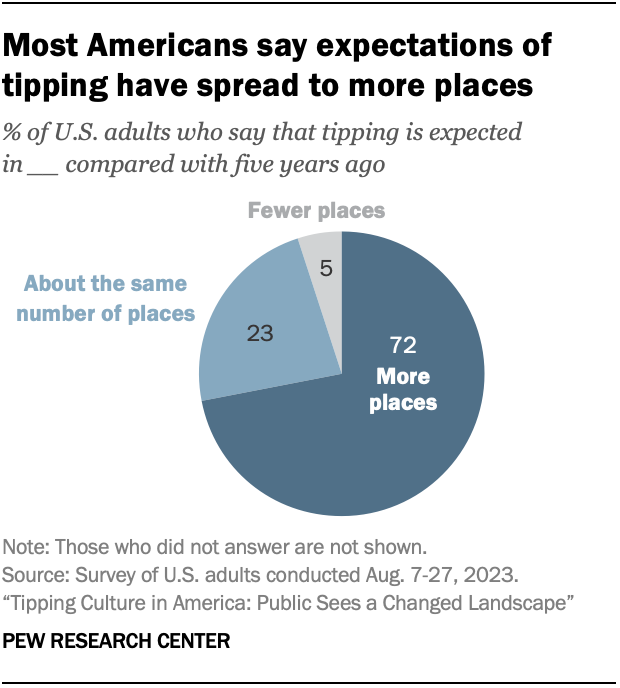
A broad majority of Americans say they’re being asked to tip service workers more frequently than in the past. Around seven-in-ten U.S. adults (72%) say tipping is expected in more places today than it was five years ago, a finding that tracks with anecdotal reporting and has even been dubbed “tipflation.”

But even as Americans say they’re being asked to tip more often, relatively few have a great deal of confidence about when and how to do so. Only about a third say it’s extremely or very easy to know whether (34%) or how much (33%) to tip for different types of services.
Nor is there consensus on whether tipping – which is built into the pay structures and business models of many service industries – is more of a choice or an obligation for consumers. Around two-in-ten Americans (21%) say it’s more of a choice, while 29% say it’s more of an obligation. The largest share (49%) say it depends on the situation, underscoring the lack of a single set of rules or expectations.
Related: Do You Tip More or Less Than the Average American?
We surveyed nearly 12,000 U.S. adults to find out how they feel about the common yet sometimes confusing custom of tipping, including whether they themselves would or wouldn’t tip in specific situations. Among our key findings:
- The public is more likely to oppose than favor suggested tip amounts. More Americans oppose (40%) than favor (24%) businesses suggesting tip amounts to their customers – for example, on the bill or on a checkout screen. Another 32% neither favor nor oppose the practice.
- Americans broadly oppose automatic service charges. About seven-in-ten adults (72%) say they oppose businesses including automatic service charges or tips on customers’ bills, regardless of group size – including half who strongly oppose the practice. Only 10% favor such charges.

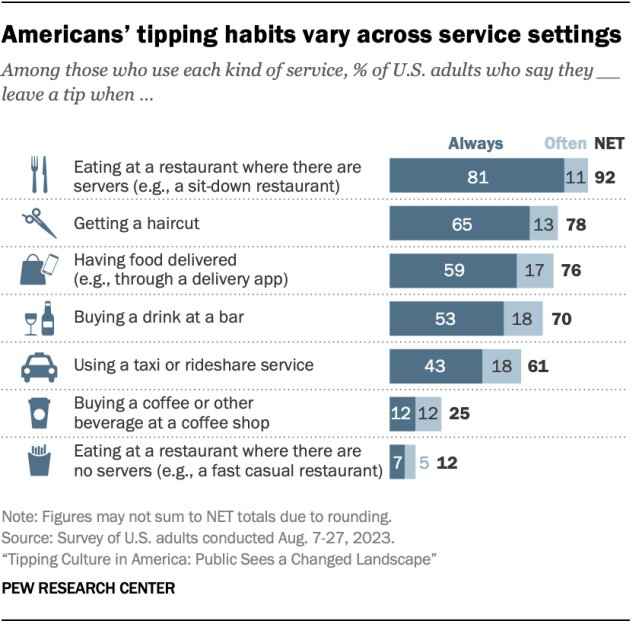
- Americans’ tipping behaviors vary widely by situation. About nine-in-ten adults who eat at sit-down restaurants (92%) say they always or often leave a tip in this scenario. Among those using other services, smaller majorities tip when getting a haircut (78%), having food delivered (76%), buying a drink at a bar (70%), or using a taxi or rideshare service (61%). Relatively few Americans always or often tip when buying a coffee (25%) or eating at a fast casual restaurant (12%).
- A majority of Americans say they would tip 15% or less for an average meal at a sit-down restaurant. Nearly six-in-ten (57%) say this, including 2% who say they wouldn’t leave any tip. Only a quarter of people say they’d tip 20% or more.
- For most people, tipping is first and foremost about service. Around three-quarters of adults (77%) say the quality of the service they receive is a major factor in deciding whether and how much to tip. None of the other factors we asked about comes close.
The survey comes at a time when tipping – a practice that Americans broadly embrace yet have long felt conflicted about – is undergoing significant structural and technological changes. These changes include the expansion of digital payment platforms and devices that encourage tipping and the spread of mandatory service charges.
For this report, Pew Research Center surveyed 11,945 U.S. adults from Aug. 7 to Aug. 27, 2023, using the Center’s nationally representative American Trends Panel. The following chapters take a closer look at:


