Satisfaction with key aspects of life doesn’t seem to be strongly linked to the type of community someone lives in. Americans in urban, suburban and rural areas are about equally satisfied with their family life, social life, job and financial situation. There is also little variation among those living in different types of places in the share reporting they have social support, feel optimistic about their lives overall or feel lonely. And the idea that life in the city feels more hectic than life in the country is not borne out by the data. Urban Americans are no more likely than those living in rural and suburban areas to say they are too busy to enjoy their lives. Meanwhile, among those who say they do not have enough income to lead the kind of life they want, rural Americans tend to be the least certain that they will ever have enough to do so.
Across community types, married adults are more satisfied with their lives
 Rural residents are slightly more likely than those in urban areas to say they are very satisfied with their family life (49% vs. 43%). Some 46% of suburban residents say the same. (This difference is driven at least in part by the fact that people in rural areas are much more likely than those in urban areas to be married.)
When it comes to their social lives, those in urban (28%), suburban (28%) and rural (26%) areas are all about equally likely to report that they are very satisfied.
Likewise, among those who are employed full or part time, similar shares say they are very satisfied with their current job or career (31% of urban, 27% of suburban and 30% of rural residents). And relatively small shares of adults in each group (whether employed or not) say they are very satisfied with their personal financial situation (14%, 18% and 17%, respectively).
While these measures of satisfaction don’t vary much by community type, some do vary by age in suburban and rural areas. Adults ages 50 and older are more satisfied than their younger counterparts when it comes to their job, social life and financial situation, and this is true across community types.
There are substantial gaps by marital status as well – married adults are much more satisfied with each aspect of their lives compared with unmarried adults. For example, 57% of married adults are very satisfied with their family life, compared with 36% of those who are unmarried. And while 32% of married adults are very satisfied with their social life, only 23% of unmarried adults are equally satisfied. This pattern holds up, for the most part, across community types.
Rural Americans tend to be the least optimistic about their financial future
 Some 37% of all U.S. adults say they currently have enough income to lead the kind of life they want, while 27% say they do not currently have enough but expect to in the future. An additional 34% say they don’t currently have enough income and don’t think they will in the future.
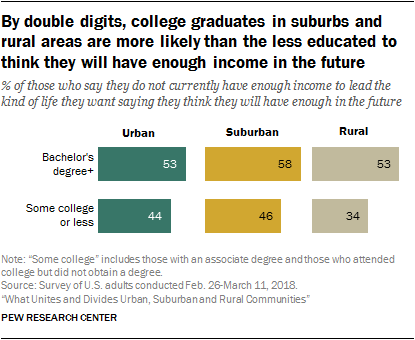
These shares vary somewhat among residents of different types of communities. People living in suburbs are more likely than those in urban areas to say they currently have enough income (41% vs. 32%), while 37% of rural residents say the same. Among those who say they do not currently have enough income for the kind of life they want to lead, rural residents are the most pessimistic: Most say they don’t think they will have enough income in the future (63%), while about half of urban (53%) and suburban (51%) residents not currently making enough say the same.
 Whether one currently has enough income coming in is closely linked to socioeconomic status: Those with higher levels of education and those identifying with the upper class are among the most likely to say they currently have enough income to lead the kind of life they want, regardless of the type of community they live in. In addition, older Americans, whites and people who are married are more satisfied with the amount of income they currently have. Among rural residents only, men are more likely than women to say they have enough income (41% vs. 34%), a gap that doesn’t exist among urban (34% vs. 31%) and suburban (43% vs. 39%) residents.
But when it comes to whether those who don’t currently have enough income think they will in the future, different patterns emerge. For example, in rural areas nonwhites who don’t have enough income now are much more likely than whites to say that they will in the future (50% vs. 31%). This is consistent in suburban (61% vs. 41%) and urban areas (52% vs. 39%) as well. Younger adults who say they currently don’t have enough are also far more likely than older adults to say they will have enough income in the future, across community types.
In rural and suburban areas, those with a bachelor’s degree or more education who don’t have enough income now are more likely than their less educated counterparts to think they will have enough in the future. About half (53%) of college graduates in rural areas who don’t currently have enough income to live the kind of life they want say they will have enough in the future, compared with 34% of their counterparts with some college education or less; the shares are 58% and 46%, respectively, among those who live in suburbs. The gap is not statistically significant among urban residents.
Similar shares across community types say they feel optimistic, busy
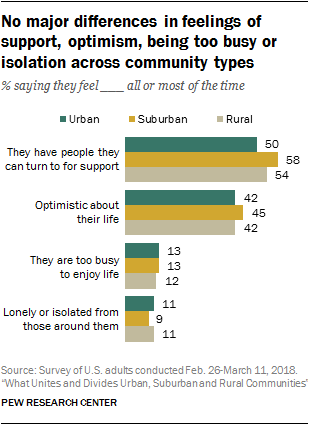
 When it comes to some of the more personal aspects of life – feeling supported by others or feeling lonely and isolated – Americans’ experiences do not seem to differ widely by what type of community they live in. Suburban residents are somewhat more likely than their urban counterparts to feel they have people to turn to for support all or most of the time (58% vs. 50%), while 54% of rural residents say the same.
Relatively few adults (about one-in-ten) across community types say they feel lonely or isolated all or most of the time. Rural (50%) and suburban residents (49%) are somewhat more likely than those in urban areas (42%) to say they hardly ever or never feel lonely or isolated from those around them.
Only 12% of Americans say they feel too busy to enjoy life all or most of the time. This sentiment is no more common in urban areas than it is in suburban or rural communities.
Similarly, there are no notable differences across community types in feelings of general optimism about life. Roughly equal shares of adults in urban (42%), suburban (45%) and rural (42%) communities say they feel optimistic about their lives all or most of the time.
 Older adults tend to fare better on these measures overall. For example, 70% of adults ages 65 and older living in rural areas say they usually have people to turn to for support, compared with 54% of those ages 50 to 64 and about half of those younger than 50. The pattern is similar among suburban residents. But in urban areas, while those ages 65 and older are more likely than adults ages 50 to 64 to say they usually have people for support (57% vs. 43%), they are not significantly more likely than younger adults to say this (51% of those ages 30 to 49 and 52% of those 18 to 29).
Similarly, older people are more likely than their younger counterparts to say they feel optimistic about their lives in suburban and rural areas but not in urban areas. And adults ages 65 and older are the least likely to say they are too busy to enjoy life, regardless of the type of community they live in.
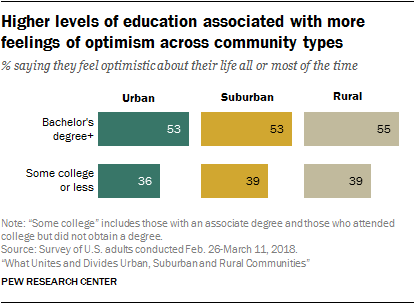
 On most items, these feelings appear to be connected to education and other indicators of socio-economic status. Those who have graduated with a four-year college degree are more likely than those who have some college experience or less to say they have people to turn to for support and are optimistic about their life all or most of the time, regardless of the type of community they live in. They are also less likely to say they feel lonely or isolated from those around them. For example, roughly half of college graduates in urban (53%), suburban (53%) and rural (55%) areas say they usually feel optimistic about their life. But about four-in-ten of those with some college experience or less education say this across communities (36% of people living in urban areas, 39% in suburbs and 39% in rural areas). However, college graduates and nongraduates alike are just as likely to say they are usually too busy to enjoy life in all types of communities.
Married Americans are significantly more likely than their unmarried counterparts to say they usually have people to turn to and are optimistic about their life. For example, 57% of married urban residents say they have people to turn to for support all or most of the time, compared with 47% of unmarried urban residents. The shares are similar in suburban (62% vs. 53%) and rural (59% vs. 51%) areas. Across community types, there are no significant differences by marital status on whether someone feels they are usually too busy to enjoy life. However, parents of children younger than 18 are more likely than those who do not have children under 18 to say this. About two-in-ten parents say they are too busy, whether they live in urban (19%), suburban (18%) or rural (17%) areas; this compares with about one-in-ten of those who are not parents in urban (10%), suburban (11%) and rural (10%) areas.


 Interactive: How has your county changed?