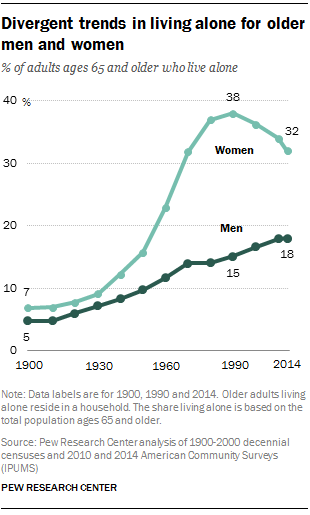
Behind the overall decline since 1990 in the share of adults ages 65 and older living alone are diverging patterns for men and women. Historically, older women have been somewhat more likely than men to live alone, but their share rose rapidly from the 1950s to 1990 before abruptly declining. By contrast, the share of older men who live alone rose more gradually from 1900 onward, and continued to increase after 1990 until it leveled off at 18% between 2010 and 2014.
In 1990, 38% of older women lived alone, compared with 15% of older men. As older women became less likely to live alone and older men more likely to do so, the 1990 gender gap of 23 percentage points in the share who live alone declined to 14 points by 2014. In that year, 32% of older women lived alone, compared with 18% of older men.
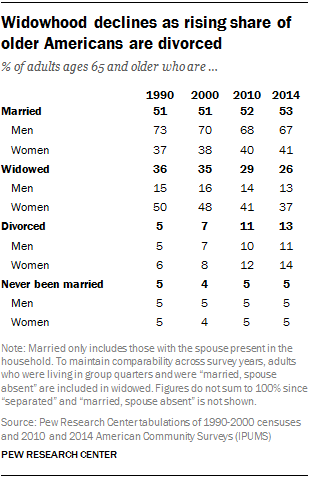
Living arrangements of older adults are closely tied to their marital status. Just over half (53%) of older adults were married and lived with their spouses in 2014, up slightly in recent decades. 4
Among the 22 million unmarried older adults, the majority (55%) lived alone in 2014. 5
Another 22% lived with their children, 16% lived with other relatives or non-relatives, and 7% lived in a nursing home or other group quarters. 6

Because of women’s higher life expectancy, they are the majority of U.S. adults ages 65 and older – 25.9 million in 2014, compared with 20.3 million men. This helps explain why a smaller share of older women than men were married and living with a spouse in 2014 (41% vs. 67%). By contrast, older women were substantially more likely to be widowed (and not remarried) than older men (37% vs. 13%), and the majority (57%) of these older widowed women lived alone in 2014.
But the share of older adults who are women is smaller now than in the past, because men’s life expectancy has risen more quickly than women’s in recent decades. 7 As a result, women made up 56% of the older U.S. population in 2014, compared with 60% in 1990.
The increase in life expectancy comes with a decline in widowhood, especially for women whose spouses are now living longer. However, the decline in widowhood in recent decades also results from a rising share of divorced older Americans who have not remarried, particularly among those ages 65 to 74. 8
Despite the narrowing of the gender gap in older adults living alone, men remain about half as likely as women to live alone today. One reason for this gender imbalance in the older population living alone is that men are more likely than women to remarry after they have been divorced or widowed. Greater likelihood of remarriage for men is, at least in part, related to the greater availability of partners for men than women. But divorced or widowed men also are more likely than similarly situated women to say that they would like to remarry.
For adults ages 85 and older, solo living has continued a gradual rise

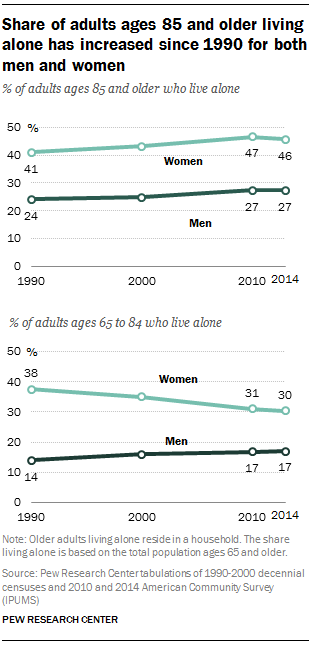
The decline in the share of older adults who live alone since 1990 is driven largely by a decline in solo living among women ages 65 to 84 (from 38% to 30%). By contrast, the share of older men living alone in this age group has increased, from 14% in 1990 to 17% in 2014.
Among Americans ages 85 and older, the share living alone has increased modestly – up to 40% in 2014 from 37% in 1990. This occurs as the number of Americans ages 85 and older also has risen, at a faster pace than the older adult population overall. Thus the number of adults ages 85 and older who live alone has also risen, to 2.4 million in 2014. (See appendix table for details on the size and share of older adults by gender and age.)
The share living alone increased for both women and men ages 85 and older between 1990 and 2010 – then leveled off for men and declined slightly for women in 2014. Among these women, the share living alone stood at 46% in 2014, up from 41% in 1990. Similarly, the share of men ages 85 and older living alone increased to 27% in 2014 – up from 24% in 1990.


