The Implicit Association Test (IAT) was developed in 1995 by Anthony G. Greenwald of the University of Washington and Mahzarin R. Banaji, now at Harvard University. The test is designed to measure unconscious or implicit preferences of individuals. In the case of race, the goal of the IAT is to measure preference for one race over another. Social psychologists who conduct IAT tests claim that the IAT is more accurate than survey self-reports when measuring the public’s hidden or “implicit” bias against racial and ethnic minorities, immigrants, gays and lesbians, older adults and other historically stigmatized groups.20
Implicit association studies of single-race blacks and whites have generally shown that whites, on average, have an automatic and subconscious preference for whites over blacks. Blacks, on the other hand, are divided or tend to favor blacks over whites, but to a lesser degree. A significant proportion of blacks also hold more favorable views of whites than they do of their own race.21
Pew Research Center, working with consultant Shanto Iyengar of Stanford University and Sean Westwood of Dartmouth College, applied the IAT race design to study multiracial adults.22 The research goal was to see if biracial adults unconsciously view one of their racial backgrounds more favorably than the other or whether they have no preference.
Who Was Tested
The big picture: The Pew Research Center team tested the racial preferences of two mixed-race groups: Adults who reported having a black and white racial background and those with a white and Asian background. Samples of single-race blacks, whites and Asians also were tested to provide a basis for comparing mixed-race with single-race adults.
Using a nonprobability sample to research a small population: For this study, researchers were interested in reaching adults with a multiracial heritage that would be willing to be involved in an online study. These groups are so rare in the population that we simply would not be able to reach enough of them using the probability-based sampling methods that are standard for Pew Research Center surveys. For this reason, we decided to take advantage of the size and online capability of an online nonprobability panel.
Specifically, in this case, study participants were selected from the YouGov online panel. The YouGov panel includes 1.5 million individuals in the United States who were recruited to take a survey through web advertising campaigns, partner-sponsored solicitations, email campaigns and telephone or mail recruitment.
Because members of the YouGov panel are not invited to join using probability-based methods, the results cannot be used to estimate precisely what would be found if the whole population of mixed-race adults or specific subgroups within that population had taken the IAT.
Creating, and matching to, a target sample: YouGov first created a target sample by randomly selecting single-race whites and blacks from the U. S. Census Bureau’s 2010 American Community Survey Public Use Microdata sample. The selected targets were replaced with individuals from the YouGov panel who were similar to the targets in the frame in terms of their race, gender, age and education. Data on voter registration status and turnout were matched to this frame using the November 2010 Current Population Survey. Data on interest in politics and party identification were then matched to this frame from the 2007 Pew Research Center Religious Landscape Survey.
Asian respondents were matched to a sampling frame of Asian Americans who were not of Indian, Bangladeshi, Pakistani or Sri Lankan descent on gender, age and education. The frame was constructed by stratified sampling from the full 2013 American Community Survey (ACS) sample with selection within strata by weighted sampling with replacements (using the person weights on the public use file).
Sampling frames of white and black and white and Asian biracial adults (excluding Asians from the Indian subcontinent and Sri Lanka) were created by first drawing samples of each target group from the Census Bureau’s full 2013 American Community Survey. Then those in the sampling frame were matched and replaced with YouGov panelists who were similar in terms of their racial background, gender, age and education.
After the matching was complete, the panelists were invited to participate in the Pew Research Center study.
Study participants: In all, a total of 3,029 adults took the Pew Research Center IAT. To avoid distorting the test results, those who made too many errors while doing the test were excluded from the analysis.23 The remaining 2,517 test subjects included 603 white and black biracial adults, 370 single-race blacks and 670 single-race whites. Roughly half of the single-race white control sample (n=328) was randomly assigned to take the white-black version of the IAT, the other half (n=342) took the white-Asian version of the test.
In addition, study participants included 470 white and Asian biracial adults and 404 single-race Asians whose country of origin or family’s country of origin was one of the countries in East Asia or the Pacific Rim, including China, South Korea, Japan, Vietnam, Thailand and the Philippines. About three-quarters of all Asians in the United States trace their ancestry to one or more of the East Asian or Pacific Rim countries. Asians who trace their families back to a West Asian country – India, Pakistan, Bangladesh, Sri Lanka or Nepal – were not included in the samples of Asians or white-Asian biracial adults.
How the Mixed-Race IAT Worked
The mechanics of an Implicit Association Test are straightforward. Respondents are given a deceptively simple task to complete: They are instructed to sort a series of words and photos into two groups. In the Pew Research Center study, participants were shown photos and asked to identify whether the person in the photo was a member of a specific racial group or not. In the case of words, they were told to identify the word as being synonymous with “good” or not.
YouGov panelists chosen for the experiment received email invitations to participate in the study and were given a link to the test site. An introductory screen informed them that they would be participating in “a brief reaction-time task” but did not disclose the purpose of the research. They also were informed that they would be asked to complete a short survey immediately following the IAT.
An instruction screen contained detailed directions on what participants were to do, followed by two practice rounds of the IAT so they could become comfortable with the task.
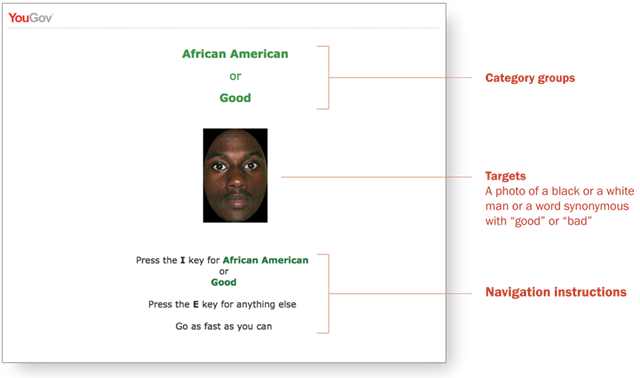
Respondents then moved on to the first test screen. If the participant was white and black biracial or single-race white or black, the category words “African American” or “white American” and the word “good” appeared at the top of the screen in large letters. These were the “category” groups – the buckets that respondents were told to use to sort the photos or words.
In the center of the screen below the race name and the word “good,” a photo of a black or a white man appeared. On the other half, a word synonymous with “good” or “bad” would be shown.
The synonyms for “good” used in the test were “wonderful,” “best,” “excellent” and “superb.” The “bad” words were “terrible,” “horrible,” “awful” and “worst.” Each good and bad word appeared at random and an equal number of times in the test. Four photos of different young white and black men also appeared randomly. (The white-Asian IAT used four photos of young Asian men along with the same photos of white men and the same “good” or “bad” words used in the white-black test.)
These photos or words were the “targets” to be categorized. The task for participants to complete was to correctly identify and categorize as quickly as they could the word or image as being either a photo of a black or white person, or a word synonymous with “good.” Study subjects were instructed to press the “I” key on their computer keyboards if the target was a photo of a member of the racial group named at the top of the screen or a “good” word. If the image in the photo was not a member of the racial group shown or if the word was one of the four “bad” words, participants were told to hit the “E” key.
Participants were specifically instructed before they began the IAT that they were not to judge whether the target word was an accurate or inaccurate description of the racial group listed at the top of the page. They only were being asked to determine if the word was a synonym for “good” or a photo of someone in the category group.
The image below is a screen shot taken from the Pew Research Center IAT. The categories are “African American” and “good.” In this case, the target is the image of a young black man. Respondents pressed the “I” key to record a correct response.

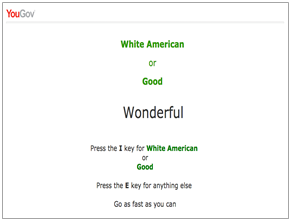
 The target in the screen shot to the right is the word “wonderful.” Since the target word is a synonym for “good”, the participant also would press the “I” key to register a correct answer.
Correcting Mistakes
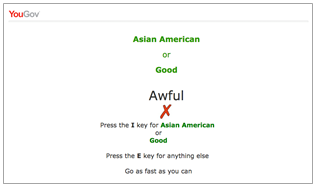
The instructions also urged participants to react to the target word or image quickly. If they mis-categorized the word or image and hit the wrong key, a red “X” appeared. The participant had to hit the correct key before he or she could move on to the next screen. In the example below, the red X appeared because the test subject hit the “I” key, recording that the word “awful” was a synonym for good. The red X would also appear if a photo of a young white man had been the target and the participant incorrectly hit the “I” key.

The photos of blacks, whites and Asians used in the test came from a database maintained by the Stanford University psychology department. Four different photos of individuals from each race were used. The images were tested to determine that they were considered to be photos of individuals of about the same age and of average physicial attractiveness. Only photos of young men were shown to avoid any differences due to age or gender. Each image and word appeared randomly an equal number of times for each category race. The race category that appeared first also varied so that category pair appeared first an equal number of times.
What the Test Measures
As test subjects took the IAT, the time it took them to correctly put the target word or image in the right category was being carefully measured and recorded.
Researchers first computed the average time it took to correctly identify the target word or image depending on the race identified as the category group. In the case of black and white biracial adults, the time it took to match the photo of a black man with the category “African American” when the word “good” was also displayed was subtracted from the time it took the test subject to match the photo of a white man with “white American” and “good.” Analysts followed the same steps when the words were used as the targets instead of photos.
The analysts determined if there was a significant difference between the average length of time it took individuals to associate good and bad words with a specific race by computing a statistic called the “D score.”24 The score can range from -2 to 2, and is calculated by subtracting the average response times for the screens that paired targets from Category A (for example, Asian American with good) with one of the positive (or negative) terms from the mean response times for the round pairing the same target from Category B (white Americans/good), then dividing this number by the standard deviation of all response times.
Those with D scores that were less than .15 but more than-.15 were classified as having little or no preference for one of the target races. Those with scores between .15 and .34 (or -.15 and -.34) were classified as having a “slight” preference. Scores between .35 and .64 (or -.35 and -.64) were classified as reflecting a “moderate” preference, while scores of .65 and higher (or -.65 and lower) were classified as indicating a “strong” preference.
The test relies on research, replicated in decades of psychological studies, that finds people are more quickly able to pair words or images together that are consistent with their internal beliefs. For example, say a test subject subconsciously views whites more positively than Asians. He or she will be quicker to associate positive words with the category “good” if the racial category is “white Americans” than if it is “Asian Americans,” and vice-versa. The same holds true when the target is a photo – respondents are faster sorting the photo of a young white man into the right category if the category race is “white American” than if it is “Asian American.”


