Black immigrants are a diverse group with notable differences in demographic, economic and geographic characteristics, often tied to the regions of their birth countries. Black immigrants are also notably different from other Americans. For example, immigrant blacks are more likely than U.S.-born blacks to have a college degree or to be married. Compared with all U.S. immigrants, immigrant blacks are more likely to hold U.S. citizenship and to speak English proficiently.
Year of Immigration
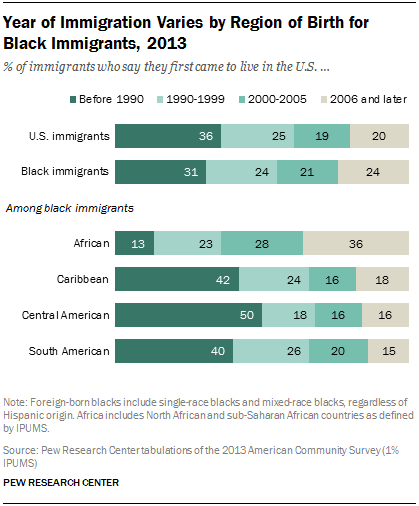 Close to half (45%) of black immigrants arrived in the U.S. in 2000 or later, with 24% saying they arrived sometime in 2006 or later, according to the Pew Research Center analysis of the 2013 American Community Survey. About a third (31%) say they began living in the U.S. prior to 1990 and 24% arrived in the 1990s.
However, year of arrival varies among black immigrants by region of birth. For example, 63% of black African immigrants are recent arrivals, having arrived in the U.S. in 2000 or later. More than one-third (36%) arrived the most recently—in 2006 or later. These are the largest recent arrival shares of any major black immigrant subgroup.
By contrast, black immigrants from the Caribbean generally have lived in the U.S. longer. Some 42% arrived in the U.S. before 1990, while just 18% arrived in 2006 or later. Black immigrants from Jamaica, Haiti and the Dominican Republic increasingly began moving to the U.S. in the 1960s.9
Among black immigrants from Central America, half arrived before 1990, the largest share of any regional group. For example, nearly half (47%) of all black Central American immigrants are Panamanian or Belizean. Panama, in particular, saw large waves in the 1980s due to the Panama Canal Act, which granted admission to Panamanians who worked on the canal, while others fled because of the Manuel Noriega regime.10
Compared with other U.S. immigrants, black immigrants are a more recently arrived immigrant population. Fully 45% of black immigrants say they first arrived in the U.S. in 2000 or later, while 39% of the overall immigrant population did so. Black immigrants are somewhat more likely to say they arrived in 2000 or later than Hispanic and Asian immigrants whose shares are 38% and 42%, respectively.11
Citizenship Status
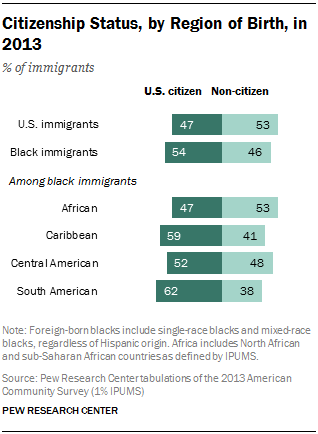 A majority of black immigrants—54%—hold U.S. citizenship, a higher share than among all U.S. immigrants (47%). Among black immigrants, citizenship rates are highest among black immigrants from South America and the Caribbean—62% and 59%, respectively. By contrast, less than half (47%) of the black African immigrant population are U.S. citizens. One possible reason for lower citizenship rates among black immigrants from Africa is that they generally have arrived more recently than other black immigrants.
According to Pew Research Center estimates, about 575,000 black immigrants are living in the U.S. without authorization, making up 16% of all black immigrants. Among black immigrants from the Caribbean 16% are unauthorized immigrants as are 13% of black immigrants from Africa. By comparison, among the nation’s 42.5 million immigrants, more than 11 million are unauthorized immigrants,12 accounting for about one-quarter of the total immigrant population, a higher share than that among black immigrants.
English-language Ability
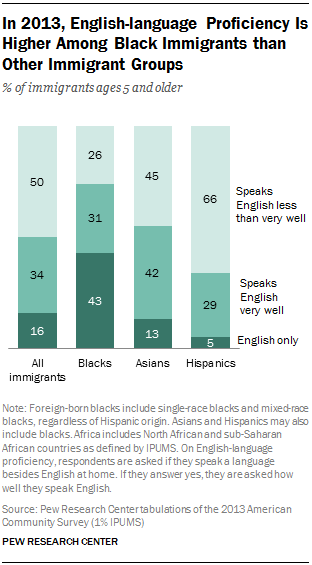 A greater share of foreign-born blacks is proficient in English than the overall U.S. immigrant population, according to the Pew Research analysis of the 2013 American Community Survey. Nearly three-quarters (74%) of black immigrants, ages 5 and over, are proficient English speakers. Some 43% speak only English at home, while an additional 31% say they speak a language other than English at home but report that they speak English “very well.”
By contrast, among all immigrants ages 5 and up, 50% say they either speak only English at home (16%) or speak a language other than English at home but also speak English “very well” (34%). And among the two largest groups of immigrants, the shares that are English proficient are lower than among blacks. Some 55% of Asian immigrants 5 and older say they speak only English at home (13%) or speak English “very well” (42%). And about one-third (34%) of Hispanic immigrants 5 and older say only English is spoken in their home (5%) or indicate they speak English “very well” but speak Spanish at home (29%).
Given that half of black immigrants are from the Caribbean, where English is widely spoken, English-language proficiency rates are high among those from the region. Black immigrants ages 5 and older from the Caribbean (76%) and South America (82%) are the most likely to be English-language proficient, compared with 72% of Africans and 60% of black immigrants from Central America.
Among black immigrants ages 5 and older, other languages spoken include French/Haitian Creole (14%), Spanish (11%), Kru (7%) and French (6%).13
Age
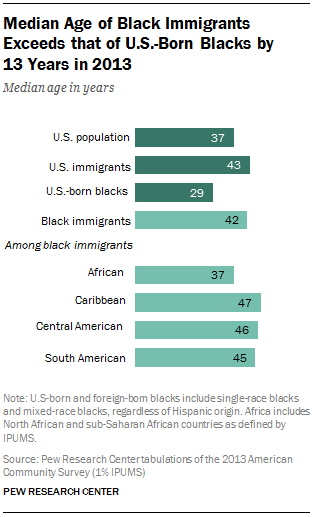 The U.S. black immigrant population is overwhelmingly made up of adults, reflecting the adult age of migration for most immigrants. About nine-in-ten (93%) black immigrants are 18 or older. Foreign-born blacks are also older than Americans overall. Their median age is 42 years, compared with 37 for the overall U.S. population. But the median age of black immigrants is similar to that for all U.S. immigrants (43 years).
There is an even larger age discrepancy between U.S.-born blacks and foreign-born blacks. The median age among U.S.-born blacks is 29 years, a full 13 years younger than what it is among blacks who are foreign born.
Median age also varies some among black immigrants. For example, the median age for black immigrants from the Caribbean is 47 years, similar to that of black immigrants from Central America (46 years) and those from South America (45 years). With a median age of 37 years, Africans are the youngest black immigrant population.
Marital Status
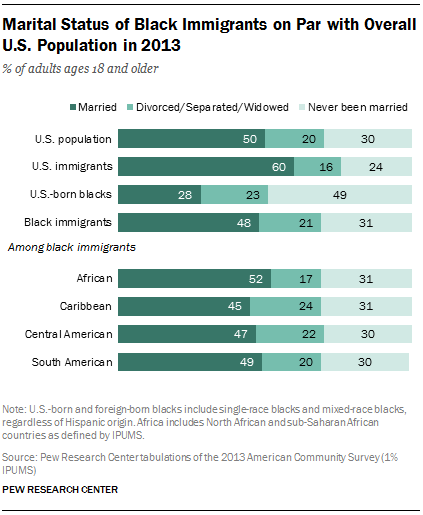 Nearly half (48%) of black immigrants ages 18 and older are married. This is comparable to the share for all U.S. adults (50%) but is below that for all U.S. immigrants (60%).
Compared to U.S.-born black adults, a significantly higher share of black immigrant adults are currently married (28% among U.S. born versus 48% among foreign born). Looked at another way, just one-third (31%) of black immigrants adults have never been married, while half (49%) of U.S.-born blacks have never been married.
There are only small differences in marriage rates within the foreign-born black adult population. Overall, 52% of African black immigrant adults are married which is the highest share among black immigrant origin groups.
Household Type
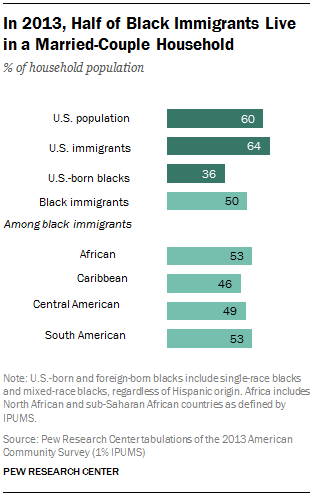 Fully 83% of black immigrants live in a family household.14 This group is made up of 50% who live in married couple households, 24% in female-headed households and 10% in male-headed family household.15
By comparison, a greater share (60%) of all Americans live in married couple households. Among U.S. immigrants, an even greater share (64%) lives in a married couple household.
However, the Pew Research analysis shows that U.S.-born blacks are less likely to live in a married couple household—just 36% do so—than black immigrants. They are also more likely than foreign-born blacks to live in a female-headed household (41% versus 24%).
Among foreign-born blacks, 53% of Africans and 53% of South Americans live in married couple households. Among Central American black immigrants, that share is 49%, while it is 46% of black immigrants from the Caribbean.
Educational Attainment
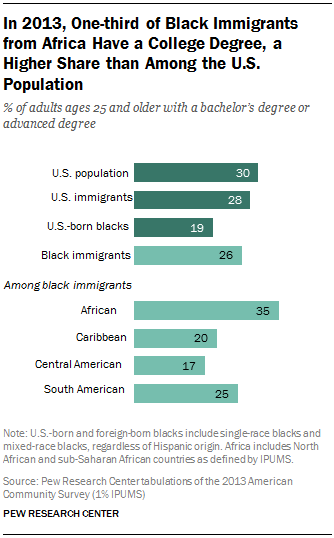 About a quarter (26%) of black immigrants ages 25 and older have a bachelor’s degree or higher. This share is below that of the overall U.S. population, in which 30% of U.S. adults 25 and older have at least a bachelor’s degree. However, the share with an advanced degree, such as a master’s degree, Ph.D. or a professional degree, is similar among all Americans (11%) and black immigrants (10%).
Black immigrants hold degrees at a similar rate as the U.S. foreign-born population—26% of the foreign-born black population ages 25 and older has at least a bachelor’s degree, comparable to 28% of all U.S. immigrants. But there are striking differences when comparing black immigrants with Asian immigrants and with Hispanic immigrants. Among those 25 and older, 50% of all Asian immigrants have completed at least a four-year degree; but only 11% of Hispanic immigrants have done so.
By comparison, U.S.-born blacks ages 25 and older are less likely to have at least a bachelor’s degree than black immigrants—19% compared with 26%.
Educational attainment varies greatly among black immigrants by birth region. Some 35% of black African immigrants ages 25 and older have at least a bachelor’s degree, including 15% who have an advanced degree. These shares are higher than any other major black immigrant subgroup. Black South American immigrants have the second highest share (25%) of college degree holders, followed by those from the Caribbean (20%). Some 17% of black Central Americans immigrants have a college degree.
Household Income
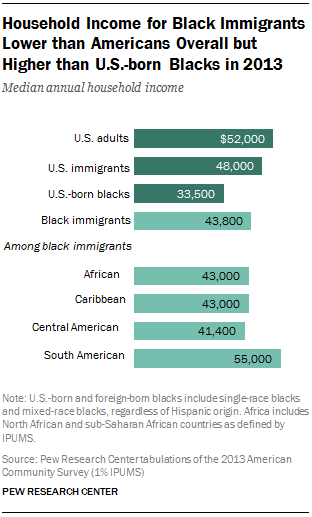 Although black immigrants have similar levels of educational attainment as Americans overall, their household incomes are lower than the median U.S. household. The median annual household income for foreign-born blacks in 2013 was $43,800. That’s roughly $8,000 less than the $52,000 median for American households.
Black immigrants’ median annual household income is below that of all U.S. immigrants ($43,800 vs. $48,000). Among immigrants, there are differences. While the median household income for black immigrants is higher than it is for Hispanic immigrants ($43,800 vs. $38,000), both groups have median household incomes substantially below that of Asian immigrants, whose median household income is $70,600.
But foreign-born blacks have a higher median income than U.S.-born blacks. U.S.-born blacks have a median household income of $33,500, a full $10,000 less than that among foreign-born black households.
Among black immigrants, the group with the highest median annual household income is South Americans, at $55,000. For African and Caribbean immigrants, both groups have a median household income of $43,000, while Central Americans have a median household income of $41,400.
Homeownership
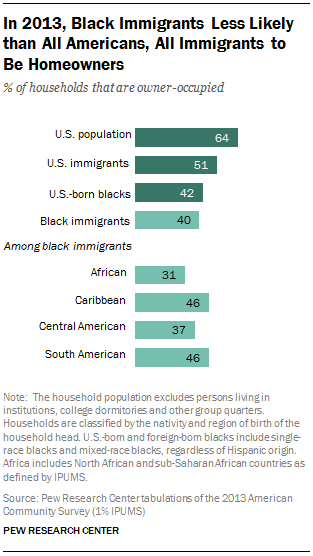 Black immigrants are less likely to be homeowners than Americans overall—40% of household heads versus 64%. And when compared with all U.S. immigrants, foreign-born blacks are less likely to own their homes—51% and 40%, respectively. Among U.S. immigrant subgroups, fully 57% of Asian immigrants are homeowners, compared with 43% of Hispanic immigrants. Both homeownership rates are higher than that for black immigrants.
Just as with other immigrants, homeownership rates vary across black immigrant subgroups. For example, 46% of black immigrants from the Caribbean and South America are homeowners, while 37% of black Central Americans are homeowners. Some 31% of black African immigrants owned their own home in 2013. But across all black immigrant subgroups, homeownership rates are below those of all Americans.
Homeownership rates vary little between U.S.-born and foreign-born blacks. Some 42% of U.S.-born blacks are homeowners compared with 40% of black immigrants.
Poverty Status
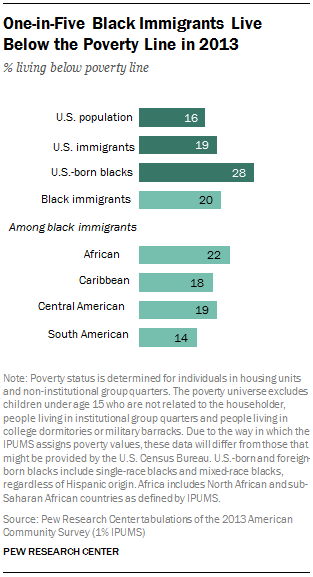 One-in-five (20%) black immigrants live below the poverty line, according to the Pew Research Center analysis of Census Bureau data. That share is below that of U.S.-born blacks, who have a poverty rate of 28%. But the poverty rate among black immigrants is higher than it is among all Americans (16%).
Among all U.S. immigrants, at 19%, the share living in poverty is similar to that for black immigrants. Overall, the poverty rate among black immigrants falls between that of Asian immigrants, at 13%, and Hispanic immigrants, at 24%.
Among black immigrants, poverty rates vary some. Some 22% of those from Africa live in poverty, as do 19% of those from Central America, 18% of those from the Caribbean and 14% of those from South America.
Geographic Dispersion of Black Immigrants
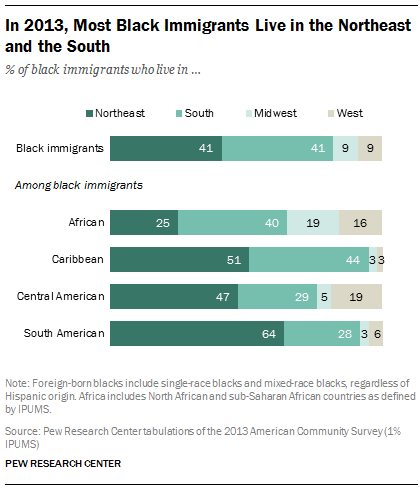 The nation’s black immigrant population is highly concentrated. More than eight-in-ten (82%) of them live in just two regions—41% live in the Northeast and 41% live in the South. Meanwhile, the Midwest and West are home to just 9% each of the black immigrant population.
Black immigrants from the Caribbean are more concentrated in the Northeast and the South—95% live there—than the overall black immigrant population.
By contrast, the black African immigrant population is more dispersed, with 40% in the South, 25% in the Northeast, 19% in the Midwest and 16% in the West. Among black immigrants from South America, 64% reside in the Northeast. And among Central American black immigrants, 47% live in the Northeast and 19% live in the West, the highest share living there among major black immigrant groups.
Looking at the top states of residence for the nation’s black immigrants, one-in-four (24%), or 910,000, live in New York state alone. Florida has the second-largest foreign-born black population with 661,000, followed by New Jersey, Maryland and Massachusetts.
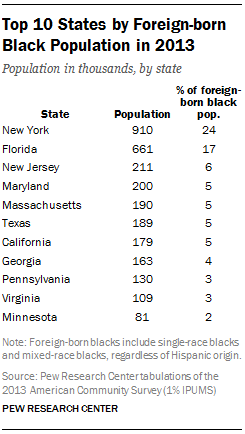 Among metropolitan areas, the New York-Newark-Jersey City metropolitan area has by far the largest black immigrant population, containing 27% of the foreign-born black population overall. The Miami-Fort Lauderdale-West Palm Beach metro area in Florida is the second largest with 12%, followed by Washington, D.C.-Arlington-Alexandria, Virginia at 6%. The Boston and Atlanta areas each account for 4% of the total black immigrant population.
Some black immigrant country of origin communities are clustered around particular metropolitan areas. For example, the New York metro area is home to roughly 250,000 black Jamaican immigrants, or nearly 40% of all foreign-born black Jamaicans in the U.S. And the Miami metropolitan area has the nation’s largest black Haitian immigrant community—more than 211,000 black Haitian immigrants, equal to 36% of its population in the U.S.
The Washington, D.C., metro area is home to the biggest black Ethiopian immigrant community in the country with 46,000 black Ethiopian immigrants living there, equivalent to 24% of that group’s U.S. population, while 25,000, or 31%, of the black Somalian immigrant population lives in the Minneapolis-St. Paul-Bloomington metro area of Minnesota and Wisconsin.
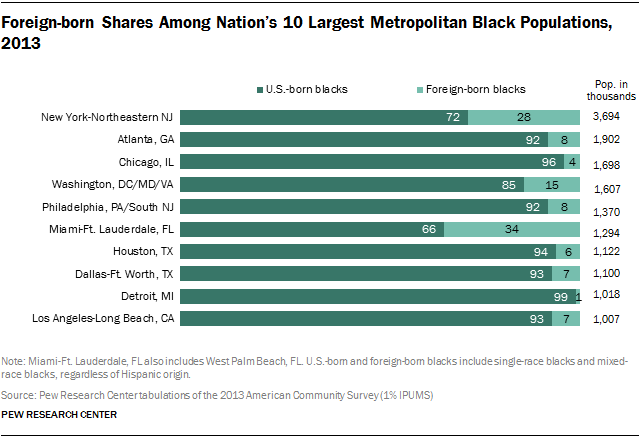
In the nation’s 10 metropolitan areas with the largest black populations, the share of these populations that are foreign born varies widely. In only three are black immigrants a double-digit share of the overall black population. About one-in-three (34%) blacks living in the Miami-Fort Lauderdale-West Palm Beach metro area in Florida are immigrants. In the New York-Newark-Jersey City metro area, foreign-born blacks make up 28% of the black population. And in the Washington, D.C., metropolitan area, 15% of the area’s blacks are foreign born. In the other seven largest black metropolitan areas, black immigrants make up a much smaller proportion of the overall black population. For example, 8% of black residents in the Atlanta metro area are foreign born. Black immigrants’ share of the overall Chicago black population is just 4%, and only 1% of blacks living in Detroit are foreign born.
