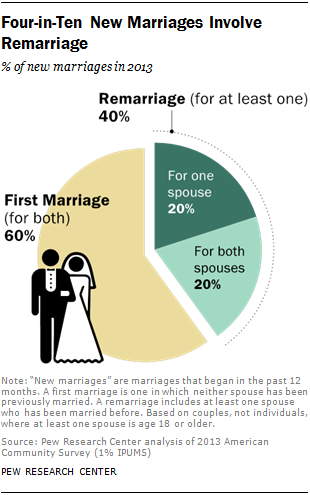
 In 2013, fully four-in-ten new marriages included at least one partner who had been married before, and two-in-ten new marriages were between people who had both previously stepped down the aisle, according to a Pew Research Center analysis of newly released data from the U.S. Census Bureau.1
This snapshot is only the latest manifestation of a decades-long rise in the number of Americans who have ever remarried. All told, almost 42 million adults in the U.S. have been married more than once, up from 22 million in 1980. The number of remarried adults has tripled since 1960, when there were 14 million.
This increase has been fueled by several demographic trends, beginning with the rise in divorce, which has made more Americans available for remarriage. It has also been fueled by the overall aging of the population, which not only increases the number of widows and widowers available to remarry, but means people quite simply have more years in which to make, dissolve and remake unions.2 Combined, these two trends have created a larger pool of people who can potentially remarry. The result? Among adults who are presently married, roughly a quarter (23%) have been married before, compared with 13% in 1960.
 A close look at the census data suggests another important trend: Even as marriage itself is in decline in the U.S., previously married people are as willing as ever to jump back into wedlock. Divorced or widowed adults are about as likely to remarry today (57% have done so) as they were more than 50 years ago. By contrast, the share of all adults who have entered into marriage even once has fallen markedly, from 85% in 1960 to 70% in 2013.
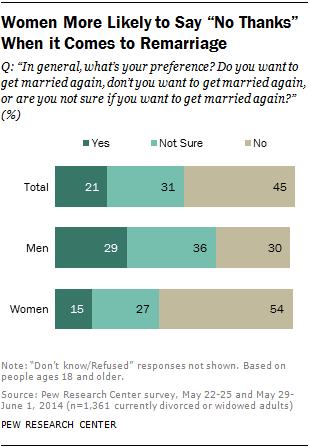
Many previously married adults have already said “I do” again. But among those who haven’t yet remarried, about half report they would like to try again or at least are not ready to rule the option out. Overall, about two-in-ten among those who are currently divorced or widowed say they want to remarry (21%) and another three-in-ten are not sure (31%), according to a recent Pew Research Center survey.3 Some 45% say they do not want to marry again.
There are definite gender differences on this question: Most currently divorced or widowed men are open to the idea of remarriage, but women in the same circumstances are less likely to be open to the idea. Among previously married men, 65% either want to remarry or are not sure; 30% say that they don’t want to remarry. Among women who are currently divorced or widowed, only 43% say they may want to remarry, while 54% say they are not interested.
The gender gap in attitudes mirrors a gap in remarriage patterns: Among previously married adults, men are more likely than women to have remarried. Fully 64% of divorced or widowed men have remarried, compared with 52% of previously married women. However, this gender gap has narrowed over time because men are now less likely to remarry than in the past, while women are more likely to do so. In 1960, 70% of previously married men had remarried, compared with 48% of previously married women.
Over this 50-year period, older adults have consistently been more likely to have remarried than their younger counterparts. And as the older population has grown in size with the aging of the Baby Boomers, these age differences in remarriage have widened. Older adults have become ever more likely to remarry, perhaps due in part to a desire to have a fulfilling relationship in their lengthening golden years, as life expectancies have increased. Fully half (50%) of previously married seniors had remarried in 2013, up from 34% in 1960.
The trend is moving the other way, however, for younger Americans, with remarriage becoming less prevalent. Among those ages 25 to 34, 43% had remarried in 2013, compared with 75% in 1960.
Earlier research has documented the strong correlation between marriage and financial well-being,4 and this pattern holds for remarried adults as well as for adults in their first marriage. On key economic measures, remarried adults fare better than their currently divorced counterparts and about as well as those in their first marriage. Some 7% of currently remarried adults are living in poverty, compared with 19% of divorced adults. The median annual personal income of remarried adults is about $30,000; this is roughly $5,000 higher than that of divorced adults. Homeownership, which often reflects wealth, is also much higher for the remarried than the divorced—79% versus 58%. Remarried adults also fare much better than those who are widowed in terms of financial well-being.
These findings are based on a Pew Research Center analysis of data from the 2013 American Community Survey, as well as the 1960 and 1980 censuses. These datasets are nationally representative of the U.S. population. The report is divided into four sections: The first focuses on overall changes in the likelihood of remarrying since 1960; the second section examines how the likelihood of remarriage varies for different demographic groups; the third section discusses the demographic and economic profile of remarried adults, compared with adults in their first marriage and presently divorced adults; and the fourth section includes an analysis of newlywed couples that are in a first marriage, compared with newlywed couples that are in a remarriage.
Other Key Findings
- Fully 8% of newly married adults have been married three times or more. This share is 10% among whites, compared with 6% of blacks, 4% of Hispanics and just 2% of Asian Americans. And 9% of newlyweds with just a high school diploma have been married at least three times. Among those who lack a high school diploma the share is 8%, and among newlyweds with a bachelor’s degree or more, 5% have been married three times or more.
- On average, the age gap between spouses in new marriages in which at least one of the spouses has been married before is wider than the age gap between those in a first marriage. Some 16% of newly remarried couples include a husband who is at least 10 years older than his wife. Among first-time newlywed couples, this share is 4%. Overall, 39% of first-time newlywed couples are within a year of each other’s ages, compared with 21% of remarried newlywed couples.
- Remarriage is more common among whites than among non-whites or Hispanics. Fully six-in-ten previously married whites have remarried, compared with 51% of Hispanics, 48% of blacks and 46% of Asian Americans.
- Previously married adults who were born in the U.S. are more likely than the foreign born to remarry (58% vs. 51%, respectively). Across time this gap has narrowed, as remarriage has risen dramatically among the foreign born, up from 40% in 1960.
About This Report
This report describes the rise in remarriage from 1960 to 2013 in the U.S., focusing in particular on the share of divorced and widowed adults who have ever remarried. It is based upon data from the Decennial Census, as well as the American Community Survey, and examines the likelihood of remarriage for different groups. Furthermore, the analysis compares the characteristics of people in a first marriage, with those who are presently in a remarriage, and those who are presently divorced.
This report is a collaborative effort based on the input and analysis of the following individuals. Kim Parker, director of social trends research; Claudia Deane, director of research practices; Michael Dimock, the president of Pew Research Center; and D’Vera Cohn, senior writer, provided editorial guidance. Gretchen Livingston, senior researcher, analyzed the data and wrote the report. Charts and tables were finalized by Anna Brown, research assistant. Michael Keegan provided additional graphic support. Number-checking was done by Eileen Patten, research analyst. The report was copy edited by Molly Rohal. Michael Suh provided web support. Find related reports online at www.pewresearch.org/social-trends.
A Note on Terminology
Any person who reports having been married at least twice is classified as “remarried.”
“Previously married” individuals are those who have either divorced or been widowed at least once, who were then available for remarriage. They are also referred to as “divorced or widowed” people in the text.
The small share of adults who report they are separated are included in the “presently married” category.
“Newlyweds” are those who married within 12 months of being surveyed.
Any couple with at least one spouse who is 18 years of age or older is included in the couple-level analyses. Only couples in which both spouses are residing together—whether in a first marriage or a remarriage—are included. Data regarding the characteristics of the small share of spouses who are not cohabiting are not available.
References to respondents who are high school graduates, or who have a high school diploma also include those who have earned an equivalent degree, such as a GED (General Educational Development) certificate.
All references to whites, blacks and Asians are to the non-Hispanic components of those populations. Asians also include Pacific Islanders. Hispanics are of any race. All race analyses are based upon 2012 data, because the RACESING variable used in the analysis has yet to be released in the 2013 IPUMS.
People born outside of the United States, including those born in Puerto Rico or other U.S. territories are classified as “foreign born.” “U.S. born” refers to persons born in the United States.
Poverty is based on the U.S. Census Bureau measure. It is defined by an income threshold that is dependent on family composition and income, adjusted for inflation. In 2013, the official poverty threshold for a family of four was $23,550.
