 As the share of never-married adults has risen, their characteristics have diverged increasingly from those of married adults.21 Today’s never-married adults are on average younger, less likely to be white and somewhat less educated than married adults.
Five decades ago, never-married adults were similar to married adults in terms of race, ethnicity and age, and they were somewhat more educated than their married counterparts. Today’s never-married adults are less likely than married adults to be employed (68% vs. 75%); just the opposite was true in 1960.22
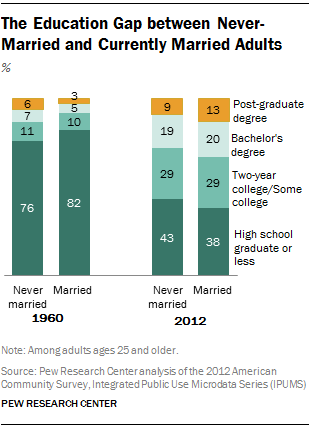
In 1960, only about one-in-ten adults ages 25 and older (9%) had never been married. They were somewhat more educated than adults who were married. About 13% of never-married adults had a bachelor’s or graduate degree, compared with 8% of adults who were married. Five decades later, when the share of never-married adults has risen to 20%, married adults are more educated than their never-married counterparts. Some 28% of never-married adults in 2012 were college graduates, compared with 34% of adults who were currently married.
In both years, adults who were divorced, separated or widowed were less educated than never-married and currently married adults.
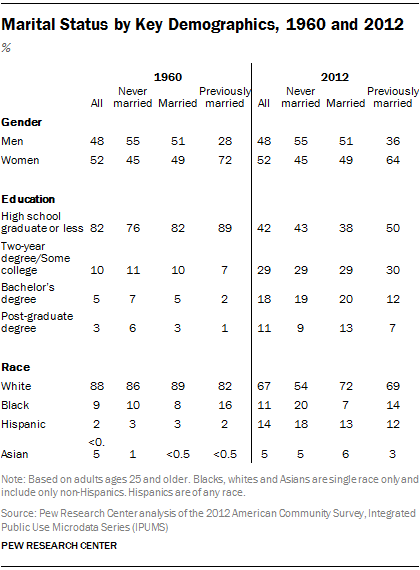 The racial and ethnic profile of never-married Americans has changed substantially over the past five decades. Today one-in-five never-married adults ages 25 and older are black, while blacks make up 7% of the married population. The gap was much smaller in 1960, when 10% of never-married and 8% of married adults were black. By contrast, whites are overrepresented among adults who are married. About seven-in-ten married adults (72%) are white, while 54% of never-married adults are white. In addition, about 18% of never-married Americans in 2012 were Hispanic, and 5% were Asian. These shares are close to the ones among married adults (13% Hispanic and 6% Asian).
Never-married adults are younger than married adults, and the age disparity has widened over time. Among those ages 25 and older today, the median age for a never-married adult is 35. For a married adult, the median age is 51. Five decades ago, the median age was 43 for never-married adults and 44 for married adults. The median age for divorced, separated or widowed adults was 62 in 1960 and 58 in 2012.23
Never-Married Men vs. Women
 As women have made significant gains in educational attainment and labor force participation, the gap between never-married men and women has widened in a number of ways.
First, never-married women ages 25 and older are more likely than their male counterparts to be college-educated. Some one-third of these women have either a bachelor’s or advanced degree, compared with one-quarter of never-married men. Five decades ago, never-married men and women were much more similar in terms of their education levels.24
Second, among never-married adults ages 25 to 64, women are more likely to be employed than men (70% vs. 67% in 2012). Never-married women first surpassed never-married men in terms of their employment rate in 2008, when 74% of never-married women were employed compared with 72% of never-married men.
Finally, the racial characteristics of never-married men and women are somewhat different now. Today, among never-married women, nearly one-quarter (24%) are black, and about half (51%) are white. By contrast, among never-married men, some 17% are black and 56% are white. The shares of Asian and Hispanics are similar among never-married men and women.
The relative age of never-married men and women has also changed over time. Among adults ages 25 and older, the median age was 47 for never-married women and 39 for men in 1960. In 2012, never-married men and women were roughly the same age, with the median age for men of 34 and for women, 35.25

 Interactive Mapping the Marriage Market for Young Adults