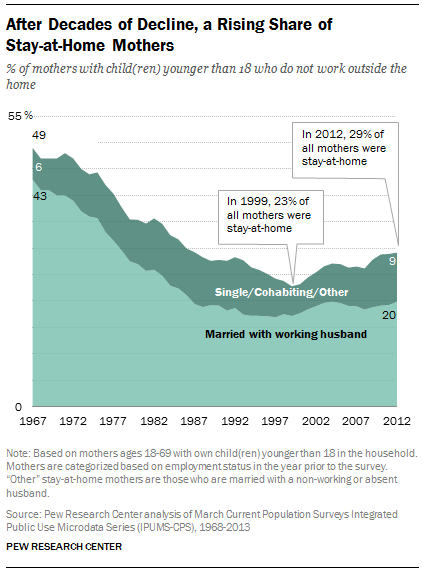
 The share of mothers who do not work outside the home rose to 29% in 2012, up from a modern-era low of 23% in 1999, according to a new Pew Research Center analysis of government data.1 This rise over the past dozen years represents the reversal of a long-term decline in “stay-at-home” mothers that had persisted for the last three decades of the 20th century.2 The recent turnaround appears to be driven by a mix of demographic, economic and societal factors, including rising immigration as well as a downturn in women’s labor force participation, and is set against a backdrop of continued public ambivalence about the impact of working mothers on young children.
The broad category of “stay-at-home” mothers includes not only mothers who say they are at home in order to care for their families, but also those who are at home because they are unable to find work, are disabled or are enrolled in school.
The largest share consists of “traditional” married stay-at-home mothers with working husbands. They made up roughly two-thirds of the nation’s 10.4 million stay-at-home mothers in 2012. In addition to this group, some stay-at-home mothers are single, cohabiting or married with a husband who does not work.
The economic ups and downs of the past decade likely influenced mothers’ decisions on whether to stay home or go to work. The share of mothers staying home with their children rose from 2000 to 2004, but the rise stopped in 2005, amid economic uncertainty that foreshadowed the official start of the Great Recession in 2007. The increase in both number and share eventually resumed: From 2010 to 2012, the share of stay-at-home mothers (29%) was three percentage points higher than in 2008 (26%), at the height of the recession.
Affluent Married Stay-at-Home Mothers
Although they are often in the media spotlight, relatively few married stay-at-home mothers (with working husbands) would qualify as highly educated and affluent. This group is sometimes called “opt-out mothers,” although some researchers say they may have been pushed out of the workforce due to work-family conflicts.
In 2012, nearly 370,000 U.S. married stay-at-home mothers (with working husbands) had at least a master’s degree and family income exceeding $75,000. This group accounted for 5% of married stay-at-home mothers with working husbands.
These affluent stay-at-home mothers, who have a median family income of nearly $132,000, are somewhat older than married stay-at-home mothers with working husbands overall, according to 2011-2012 data. Half are ages 35-44, while just 19% are younger than 35. As is true of all married stay-at-home mothers, about half of this elite group (53%) has at least one child age 5 or younger at home.
These women stand out from other married stay-at-home mothers in that they are disproportionately white or Asian. About seven-in-ten (69%) are white, and fully 19% are Asian. Only 7% are Hispanic, and 3% are black.
A growing share of stay-at-home mothers (6% in 2012, compared with 1% in 2000) say they are home with their children because they cannot find a job. With incomes stagnant in recent years for all but the college-educated, less educated workers in particular may weigh the cost of child care against wages and decide it makes more economic sense to stay home.3
Married stay-at-home mothers are more likely than single or cohabiting stay-at-home mothers to say they are not employed because they are caring for their families (85% said this in 2012). By comparison, only 41% of single stay-at-home mothers and 64% of cohabiting mothers give family care as their primary reason for being home, according to census data. They are more likely than married stay-at-home mothers to say they are ill or disabled, unable to find a job, or enrolled in school.
The recent rise in stay-at-home motherhood is the flip side of a dip in female labor force participation after decades of growth.4 The causes are debated, but survey data do not indicate the dip will become a plunge, as most mothers say they would like to work, part time or full time.
(Stay-at-home fathers, while not the focus of this report, represent a small but growing share5 of all stay-at-home parents.6)
Demographic Characteristics
 The share of stay-at-home mothers has risen since 2000 among married mothers with working husbands and single mothers. Whether married, single or cohabiting, each group of stay-at-home mothers has a demographic profile distinctly different from that of their working counterparts—and also different from each other’s. No matter what their marital status, mothers at home are younger and less educated than their working counterparts. Among all stay-at-home mothers in 2012, about four-in-ten (42%) were younger than 35. This compares with roughly a third (35%) of working mothers. Half (51%) of stay-at-home mothers care for at least one child age 5 or younger, compared with 41% of working mothers.
Fully 49% have a high school diploma or less, compared with 30% of working mothers. In addition, stay-at-home mothers are less likely than working mothers to be white (51% are white, compared with 60% of working mothers) and more likely to be immigrants (33% vs. 20%). The overall rise in the share of U.S. mothers who are foreign born, and rapid growth of the nation’s Asian and Latino populations, may account for some of the recent increase in the share of stay-at-home mothers.
One of the most striking demographic differences between stay-at-home mothers and working mothers relates to their economic well-being. Fully a third (34%) of stay-at-home mothers are living in poverty, compared with 12% of working mothers.
There also is substantial variation among stay-at-home mothers. Those who are married with working husbands generally are better off financially than the other groups. They are more highly educated, and relatively few are in poverty (15%), compared with a majority of other stay-at-home mothers. Married stay-at-home mothers (whether their husbands work or not) also are markedly more likely than single or cohabiting stay-at-home mothers to be foreign born. Single or cohabiting stay-at-home mothers are younger than their married counterparts; most are younger than 35, compared with about four-in-ten married stay-at-home mothers.
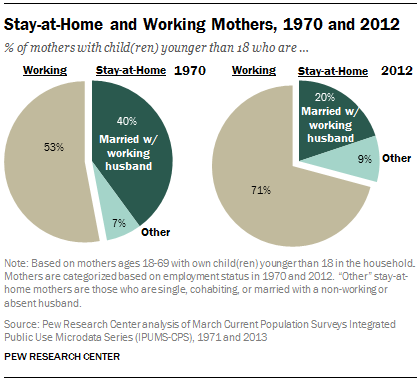
 Among all mothers, the share who are stay-at-home mothers with working husbands fell to 20% in 2012 from 40% in 1970. Among all stay-at-home mothers, those who are married with working husbands make up the largest share (68% in 2012), but that has declined significantly from 1970, when it was 85%. As marriage rates have declined among U.S. adults, a growing share of stay-at-home mothers consists of single mothers (20% in 2012, compared with 8% in 1970). About 5% are cohabiting mothers, and 7% are married mothers whose husbands do not work.
Other significant changes in the nation’s demographics since 1970 also have reshaped the profile of stay-at-home mothers. As women’s education levels have risen, 25% of 2012’s stay-at-home mothers were college graduates, compared with 7% in 1970. And 19% in 2012 had less than a high school diploma, compared with 35% in 1970. In spite of these educational gains, the share of stay-at-home mothers living in poverty has more than doubled since 1970.
This report analyzes the prevalence and characteristics of U.S. mothers living with their children younger than age 18, using data from the Census Bureau’s Current Population Survey. The analysis looks at trends from 1970 to 2012,7 focusing most closely on patterns since 2000, including the years surrounding the Great Recession from 2007 to 2009. In addition, the report compares time use of mothers at home and mothers at work, using data from the 2003-2012 American Time Use Survey. It also explores public opinion findings about mothers at home and at work.
 The changing circumstances of mothers have clear implications for the nation’s children. About three-in-ten children (28%) in the U.S. today are being raised by a stay-at-home mother. This totaled 21.1 million in 2012 out of 74.2 million Americans younger than 18,8 up from 17.3 million (24% of children) in 2000. In 1970, 48% of children (34 million) had a mother who stayed at home.
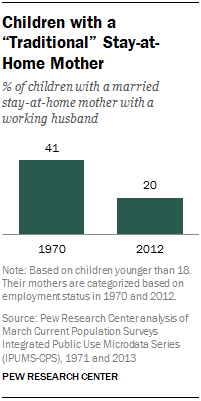
One-in-five U.S. children today are living in a household with a married stay-at-home mother and her working husband. In 1970, 41% of children lived in this type of household. In 2012, 5% of children (3.7 million) lived with a single stay-at-home mother, and 1% (992,000) with a cohabiting stay-at-home mother. An additional 1.5 million children (2% of the total) lived with married parents who were both out of the paid workforce.
Most children today, regardless of race or ethnicity, are growing up with a working mother. Asian and Hispanic children are the most likely to be raised by stay-at-home mothers—37% and 36%, respectively, were in 2012. That compares with 26% of white children and 23% of black children.
Time Use of Mothers
Analysis of time-use diaries finds that mothers at home spend more hours per week than working mothers on child care and housework,9 as well as more time on leisure and sleep. Time use also varies among different groups of mothers at home: Married stay-at-home mothers put more time into child care and less into leisure than their single counterparts.
Overall, mothers at home spend 18 hours a week on child care10, compared with 11 hours for working mothers, a seven-hour difference. The child-care time gap between mothers who work outside the home and those who do not is largest among married mothers with working husbands. There is a nine-hour disparity in weekly child-care hours of stay-at-home married mothers with employed husbands (20 hours) compared with working married mothers with employed husbands (11 hours). The difference for cohabiting mothers is seven hours, and it is five hours for single mothers.
Public Opinion
 Public opinion has grown more supportive of working mothers over time. When the General Social Survey first asked in 1977 whether a working mother “can establish just as warm and secure a relationship with her children” as a mother who stays home, only half of Americans (49%) agreed. That share generally rose until 1994, when it was 70%, then declined into the low to mid-60s over the following decade. Since 2008, the share agreeing has reached 70% or more.
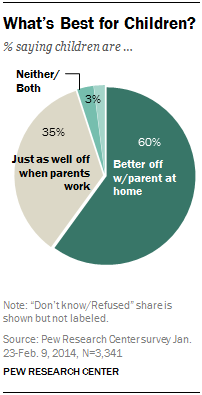
However, Americans also continue to think that having a mother (or parent) at home is best for a child. In a recent Pew Research survey, 60% of respondents said children are better off when a parent stays home to focus on the family, compared with 35% who said children are just as well off with working parents.
About the Data
Findings in this report are based primarily on data from the Current Population Survey and the American Time Use Survey.
Current Population Survey Data: Analyses of the trends and demographic characteristics of U.S. mothers are based on data from the 1971-2013 Annual Social and Economic Supplement (ASEC) of the Current Population Survey (CPS), which is conducted jointly by the U.S. Census Bureau and the Bureau of Labor Statistics. These data are collected each March and included about 90,000 household interviews in 2013. The data were obtained from the Integrated Public Use Microdata database (IPUMS-CPS), provided by the University of Minnesota. Further information about the IPUMS is available at http://www.ipums.org.
The Pew Research Center analyses are based upon all women ages 18-69 who report living with at least one of their own children younger than 18 years of age. Responses include all biological children, adopted children and stepchildren.
While the analyses based on time-use data classify mothers and their husbands or partners based upon their current employment status, the demographic analyses categorize them based upon their employment status during the prior year. This is similar to the approach adopted by the U.S. Census Bureau.
American Time Use Data: The time-use findings presented in Chapter 3 are based on the American Time Use Survey (ATUS) 2003-2012. The ATUS is the nation’s largest survey on time use and the only federal survey providing such data. It was launched in 2003 by the Bureau of Labor Statistics. The ATUS sample is nationally representative and drawn from the Current Population Survey. The ATUS interviews a randomly selected individual age 15 or older from a subset of the households that complete their eighth and last interview from the CPS. Interviews are conducted over the telephone. The monthly sample is divided into four randomly selected panels, one for each week of the month. It is also split evenly between weekdays and weekends. The response rate for each year has been above 50% since the survey started in 2003. For more information on the ATUS methodology, see http://www.bls.gov/tus/atususersguide.pdf.
The Pew Research Center analyses are based on the yearly ATUS data from 2003 to 2012. To increase the sample sizes for mothers in different type of families, we pooled the data for all years. The sample size for all stay-at-home mothers ages 18 to 69 with their own child(ren) younger than 18 is 10,535, including 6,640 married mothers who are not employed and whose husbands are working for pay; 266 stay-at-home mothers who are cohabiting; and 2,558 single mothers who are not employed. There are 1,071 married (n=970) or cohabiting mothers (n=101) who are not employed and whose husbands/partners are not employed either. These mothers are included in the overall stay-at-home mothers, but not analyzed separately.
Employment status in the ATUS is measured for the previous week; this measure differs from Current Population Survey data used elsewhere in this report, for which employment status is measured for the prior year. The ATUS data files were downloaded from ATUS-X (www.atusdata.org).* The data were weighted to adjust for nonresponse, oversampling and weekend and weekday distribution.
*Sandra L. Hofferth, Sarah M. Flood, and Matthew Sobek. 2013. American Time Use Survey Data Extract System: Version 2.4 [Machine-readable database]. Maryland Population Research Center, University of Maryland, College Park, Maryland, and Minnesota Population Center, University of Minnesota, Minneapolis, Minnesota.


 Fact Tank 7 Key Findings About Stay-at-Home Moms