This section looks at a variety of economic, educational, health, political and social indicators to assess change in the relative well-being of black and white Americans in recent decades.
The data present a mixed picture. The economic gulf between blacks and whites that was present a half century ago has not disappeared. Measures of household income, household wealth, and homeownership show that the gaps are as wide or wider today as they were in the 1960s and 1970s. The incarceration rate of black men is more than six times higher than that of white men, slightly larger than the gap in 1960.
There are also large and widening gaps between blacks and whites in key aspects of family formation. The falloff in marriage rates has been much steeper among African Americans than among whites. The share of births to unmarried women has risen sharply among both groups; however, the rate among blacks is more than double that among whites.
On the other hand, blacks have made progress relative to whites in other important realms. The gap in high school completion between blacks and whites has narrowed, as has the white-black gap in life expectancy. And, while blacks had lagged behind whites in voter participation for most of the past half century, turnout among blacks nearly matched that of whites in the 2008 presidential elections and surpassed it in 2012.
Income
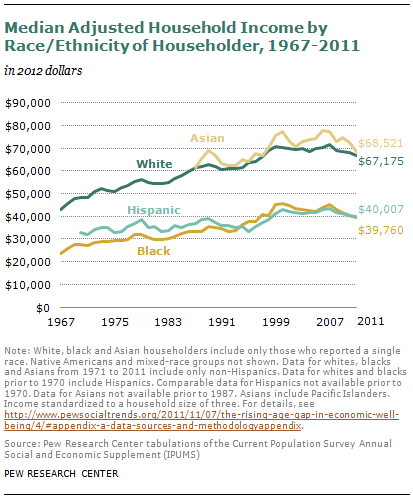 The median household income2 for whites was $67,175 in 2011, as reported in the Census Bureau’s March 2012 Current Population Survey. For blacks, it was $39,760; for Asians, $68,521; and Hispanics $40,007.
Black and white incomes have risen since the late 1960s, but both have declined since 2007, the year that marked the beginning of the Great Recession. Since the 1960s the difference in black and white incomes grew from about $19,000 in 1967 to roughly $27,000 in 2011.
The median black household income in 2011 was 59% of median white household income. This represents a modest increase from 1967, when median black income was 55% of white income. Since then, black income has ranged from 54% of white incomes to 65% (in 2000, during a period of economic growth and low unemployment). The racial income gap has increased somewhat since 2007, when black income was 63% of white income.
The income gap between whites and Hispanics has widened since 1970, when Hispanic median household income was 68% that of whites. In 2011, Hispanic income was 60% of white income, a gap that has not changed since 2007. Comparative income data for Asians is available only since 1987, when Asian income was about equal to white income. In 2011, Asian income was 102% of white income.
Poverty
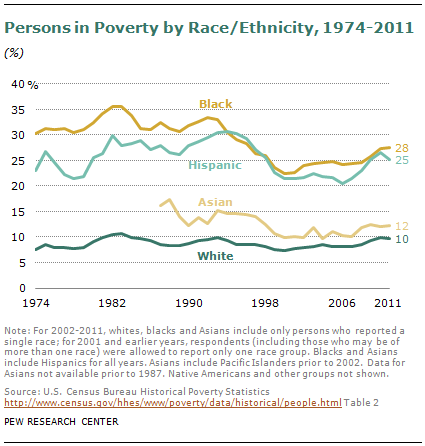 Black Americans are nearly three times as likely as white Americans to live in poverty, according to the 2012 March Current Population Survey.3 Among whites, 10% were poor in 2011, compared with 28% of blacks, 25% of Hispanics and 12% of Asians.
Looking at trends, the black-white poverty gap remains wide, although it has narrowed somewhat since the mid-1970s, as white poverty rose slightly and black poverty declined slightly. In 1974, 8% of whites were poor but so were 30% of blacks. The black-white gap has not changed markedly since 2007.
The Hispanic-white poverty gap has narrowed somewhat since 1974, when Hispanic poverty was 3.0 times white poverty, compared with 2.6 times in 2011. The Asian-white poverty gap has also narrowed somewhat; Asians are 1.2 times as likely as whites to be in poverty now, compared with 1.9 times as likely in 1987, the first year for which data became available.
Wealth
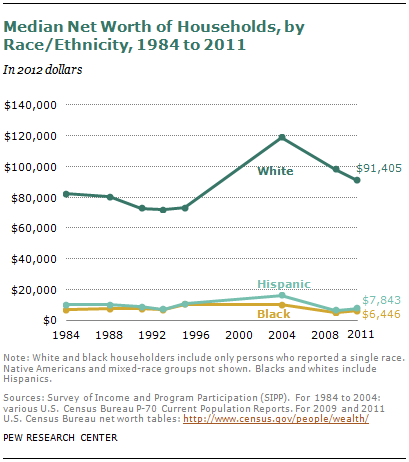 In 2011, the typical white household had a net worth of $91,405, compared with $6,446 for black households, $7,843 for Hispanic households and $91,203 for Asian households. The figures for net worth—also known as wealth—are based on assets minus liabilities in Census Bureau data from the Survey of Income and Program Participation.
The gap between black and white wealth has grown somewhat since 1984, the first year for which data became available. In 1984, black households had a median net worth equal to 9% that of white households, compared with 7% in 2011. The gap narrowed somewhat in the 1990s: In 1995, black net worth was 14% of white net worth.
Hispanic net worth also is notably smaller than white net worth, and the gap has widened over time. In 1984, the typical Hispanic household had 13% of the wealth of the typical white household. In 2011, the typical Hispanic household had 9% of the wealth of the typical white household. Figures for Asian wealth are available only since 2004; in 2011, the typical Asian and white households had about equal net worth.
Homeownership
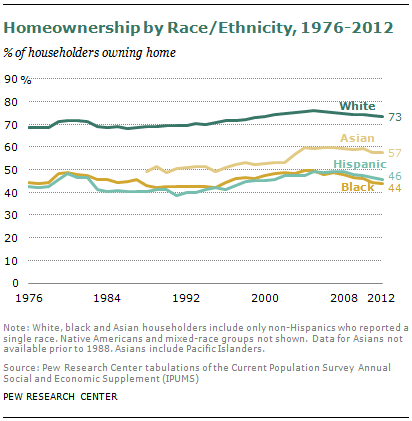 In 2012, 73% of white households owned their own homes, compared with 44% of black households, 57% of Asian households and 46% of Hispanic households, according to the Census Bureau’s Annual Social and Economic Supplement.
In 2012, black homeownership levels were 60% of white levels. The size of the white-black homeownership gap has fluctuated since 1976, when the black rate was 64% of the white rate. The gap narrowed through the mid-1980s, widened through the mid-1990s, narrowed again, and widened after the onset of the Great Recession in 2007. The black homeownership rate in 2012 is no different from what it was in 1976, but the white rate has risen somewhat, contributing to a modest growth of the black-white gap in homeownership rates.
The Hispanic-white gap in 2012 is about what it was in 1976, when the Hispanic rate was 62% of the white rate (in 2012, it was 63% of the white rate). The gap widened in the mid-1980s to the mid-1990s, in concert with a wave of Latino immigration, then it narrowed again. The gap has grown somewhat since 2007, when Hispanic homeownership was 66% of white homeownership.
Data on Asian homeownership, available since 1988, indicate that the Asian-white gap has narrowed since then. In 2012, the Asian homeownership rate was 78% of the white rate; in 1988, it was 71%.
Education
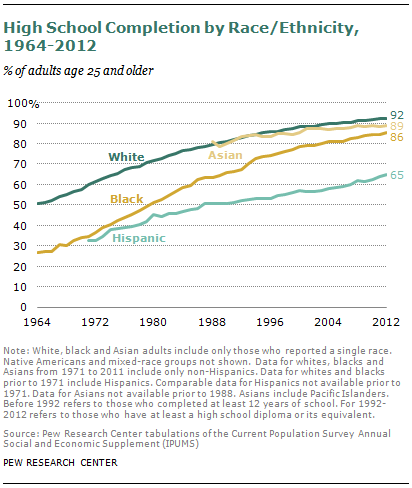 Today’s high school completion rates are similar for adults ages 25 and older who are white, black or Asian, but they lag for Hispanics. In 2012, 92% of white adults, 86% of black adults and 89% of Asian adults had at least a high school education, as did 65% of Hispanic adults.
High school completion rates have climbed for all four groups in recent decades, according to the Current Population Survey, but more sharply for blacks and Hispanics than for whites, so those two groups have narrowed the attainment gap with whites.
In 1964, the year after the March on Washington, 51% of whites had completed high school, compared with 27% of blacks. The black high school completion rate was 53% that of the white rate. In 2007, the black rate was 91% that of the white rate. By 2012, the black high school completion rate was 93% that of the white rate.
The Hispanic high school completion rate is well behind the white rate, but the gap has narrowed since 1971, when data became available. In 2012, the Hispanic rate was 70% that of the white rate. In 1971, when only 33% of Hispanic adults had completed high school, the Latino high school completion rate was 54% that of the white rate.
The Asian high school completion rate in 2012 was 96% that of the white rate, nearly equal. Since 1988, when data for Asians became available, Asians have equaled or nearly equaled white high school completion rates.
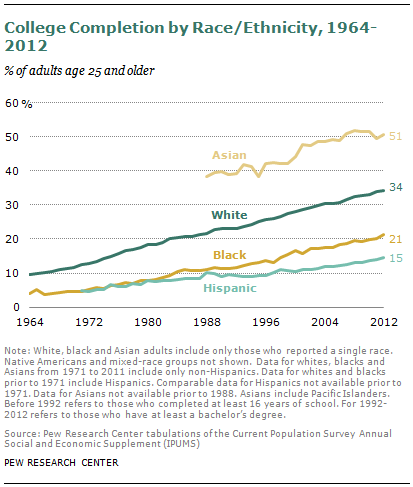 Looking at adults ages 25 and older, the gap in college completion between whites and blacks, as well as the gap between whites and Hispanics, is larger than that in high school completion. In 2012, 34% of white adults had finished college, compared with 21% of black adults and 15% of Hispanic adults. Among Asians, 51% had completed college, a higher share than for whites.
The black-white gap generally has narrowed over time, with some peaks and valleys. In 2012, the black college completion rate was 62% that of the white rate, compared with 42% in 1964. The 2012 gap is slightly narrower than in 2007, when the black college completion rate was 59% that of the white rate. Expressed a different way, the difference in the percentage of blacks and whites who completed a bachelor’s degree about doubled during that time, from 6 percentage points in 1964 when 4% of blacks and 10% of whites had completed college to 13 points in 2012.
The Hispanic-white gap has changed little since 1971, when data for Hispanics became available. In 2012, the Hispanic college completion rate was 42% that of the white rate. In 1971, when 5% of Hispanics had completed college and 12% of whites had, the Hispanic rate was 39% that of the white rate.
The Asian college completion rate has exceeded the white rate since data for Asians became available in 1988. That year, the Asian rate was 176% that of the white rate; in 2012, it was 147% of the white rate of college completion.
Life Expectancy
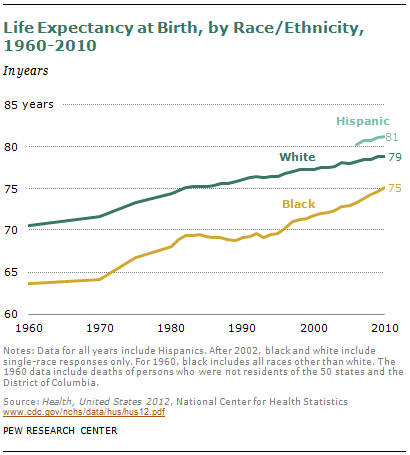 White life expectancy at birth exceeds black life expectancy at birth by nearly four years, according to data from the National Center for Health Statistics. A white baby born in 2010 could expect to live to 78.9 years of age, while a black baby could expect to live 75.1 years.4
The gap in black and white life expectancy has narrowed somewhat since 1960. In that year, white life expectancy at birth was 70.6 years, and black life expectancy at birth was 63.6 years, a disparity of seven years. Thus, black life expectancy at birth was 90% of that for whites in 1960 and 95% in 2010.
Data for Hispanic life expectancy are more limited because of a variety of data quality issues.5 Hispanic life expectancy at birth in 2006, the earliest year available from the National Center for Health Statistics, was higher than white life expectancy, and it remained so in 2010.
Voter Turnout
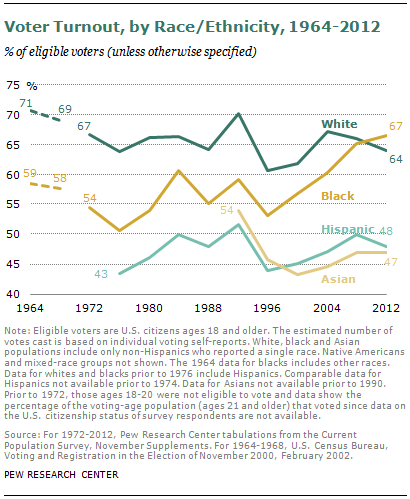 Census Bureau estimates of voter turnout by race indicate that black voters have not only closed the gap with white voters in participation, but they exceeded whites on this measure in the 2012 presidential election. In 2012, 67% of eligible black voters cast ballots, compared with 64% of eligible white voters.
By contrast, in the 1964 presidential election, an estimated 71% of eligible white voters participated, compared with 59% of black voters.6 The size of the gap in black and white voter participation has fluctuated since then, with black participation ranging from 79% to 87% of white participation through 1996.
In 2000, the black participation rate was 92% that of the white rate. The gap narrowed dramatically to 99% in 2008, the year Barack Obama ran for president as the first black major-party nominee. In 2008, 65% of black eligible voters participated, compared with 66% of whites.
Estimates for Hispanic participation are available back to 1976, when 43% of eligible Latino voters cast ballots, compared with 64% of white eligible voters. Hispanic participation rose to 48% in 2012, while white participation remained at 64%. Hispanic participation was 68% of white participation in 1976, and 75% of white participation in 2012.
Voting estimates are available for Asians dating back to 1992, when 54% of eligible Asian-Americans cast ballots, compared with 70% of whites. (The 70% white rate was the highest estimated participation rate since 1964.) Voter participation rates declined for Asian Americans in 2012, to 47%. Asian-American voter participation was 73% that of white participation in 2012, compared with 77% in 1992.
Marriage and Births
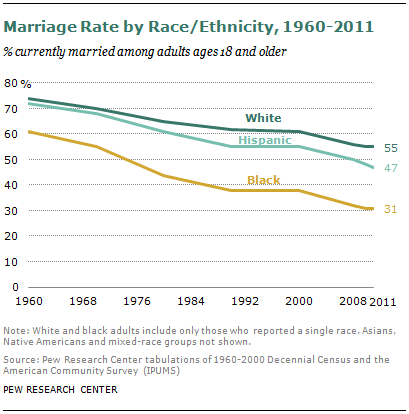 Marriage is considered an indicator of well-being in part because married adults are economically better off, although that may reflect the greater propensity of affluent adults to marry.
In 2011, 55% of white adults ages 18 and older were married, compared with 31% of black adults ages 18 and older, according to Census Bureau statistics. Thus, the marriage rate for black adults was 56% that of the white rate.
Marriage rates have fallen for all groups, but more sharply for blacks than for whites. In 1960, 74% of white adults were married, as were 61% of black adults. In that year, the marriage rate for black adults was 82% that of the white rate.
To some extent, the differences reflect a widening gap in the marriage rate by educational attainment. In 1960, marriage rates were similar for well-educated and less-educated Americans, but these days college graduates are markedly more likely to be married than those with a high school diploma or less.
In 1960, 72% of Hispanic adults were married, similar to the rate for white adults. In 2011, 47% of Hispanic adults were married, 85% of the marriage rate for white adults that year.
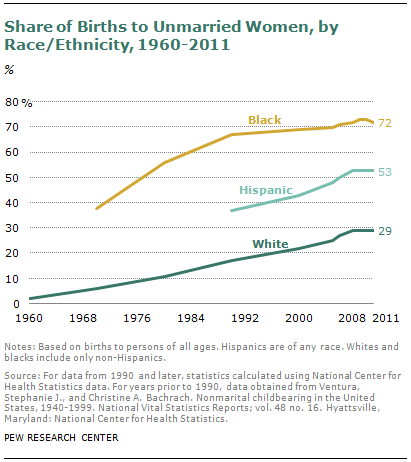 The share of births to unmarried parents also has risen for all groups, accounting for 41% of births in 2011, according to the National Center for Health Statistics. In 2011, 72% of births to black women were to unmarried mothers, compared with 29% of births to white women. The share of births to unmarried black women was about two and a half times the share to white women.
In 1970, 38% of births to black women were to unmarried mothers, compared with 6% of births to white women. The share of births to unmarried black women was more than six times the share of births to unmarried white women.
Incarceration
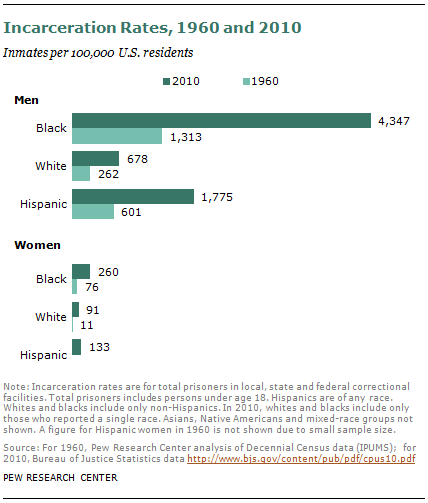 In 2010, the incarceration rate for white men under local, state and federal jurisdiction was 678 inmates per 100,000 white U.S. residents; for black men, it was 4,347. According to the Bureau of Justice Statistics, black men were more than six times as likely as white men to be incarcerated in 2010.
In 1960, the white male incarceration rate was 262 per 100,000 white U.S. residents, and the black male rate was 1,313, meaning that black men were five times as likely as white men to be incarcerated.
The incarceration rate for Hispanic men in 2010 was 1,775 per 100,000 U.S. Hispanic residents; in 1960, it was 601. In other words, Hispanic men were nearly three times as likely as white men to be incarcerated in 2010 (1,775 versus 678 respectively), and somewhat more than twice as likely in 1960 (601 versus 262 respectively).
Statistics for female prisoners show a similar pattern but a different trend. Black women are more likely to be incarcerated than white women, but the gap between both groups is smaller than it was. In 2010, the incarceration rate for white women was 91 per 100,000 white residents; for black women it was 260. In 1960, the white rate was 11, and the black rate was 76.


 Interactive Tracking 50 Years of Demographic Trends