 The tendencies of young adults to leave home later and to delay or forgo marriage have been well-documented (Settersten and Ray, 2010; Pew Research Center, 2011a; Mykyta, 2012). Less attention has been paid to characteristics of young adults once launched. Available financial data make it difficult to pin down the exact timing of such financial milestones as when a person first buys a home or car. Nonetheless, households headed by young adults have weathered the past decade financially in a significantly different fashion than older adults.
The flow of cheap credit and the accompanying expansion of debt reached its zenith with the popping of America’s housing bubble in 2006. From 1980 until the mid-2000s, the typical American household had rising levels of debt outstanding (Dynan and Kohn, 2007). Although the specifics vary by metropolitan area, national housing prices peaked in 2006 and the Great Recession commenced in December 2007. At the same time, the period of household deleveraging and reduction of debt commenced. The reduction of household debt has not been uniform across households.
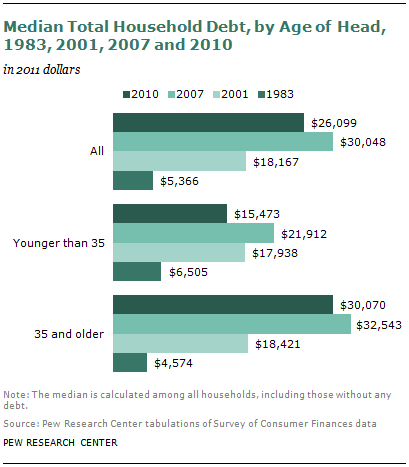
 From 2001 to 2010 households headed by young adults have reduced their overall indebtedness. By contrast, households headed by those age 35 and older increased their indebtedness from 2001 to 2010. The typical household headed by those younger than 35 had about $18,000 in debt outstanding in 2001, according to the Federal Reserve’s Survey of Consumer Finances (SCF). Since rising to about $22,000 in 2007, young adult household indebtedness has markedly declined. The median young adult household owed only about $15,000 to creditors in 2010. Older households have also deleveraged since 2007, but not nearly to the extent of households headed by young adults. The typical household headed by those age 35 and older was $30,000 in debt in 2010. This was much more indebted than they were in 2001 ($18,000), but less indebted than they were in 2007 ($33,000). In short, the typical American household grew more indebted in the new millennium, but not the typical American household headed by a young adult.
 The changing debt fortunes of young adults are even more surprising when placed in their historical context. Perhaps reflecting all the changes when young adults launch and establish independent households (as well as changes in the age when older Americans can “burn” their mortgage), in 1983 the typical young adult household was more in debt (about $7,000) than the typical household headed by those 35 and older (about $5,000). This has starkly reversed. Relative to 30 years ago, the typical older household in 2010 was more in hock to its creditors ($30,070) than households headed by young adults ($15,473).
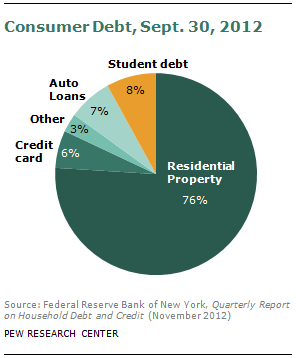
Changes in total debt almost invariably involve mortgage debt and the ownership of homes. Debt related to homes is the single largest type of debt, accounting for 76% of all consumer debt outstanding as of the third quarter of 2012 (Federal Reserve Bank of New York, 2012).
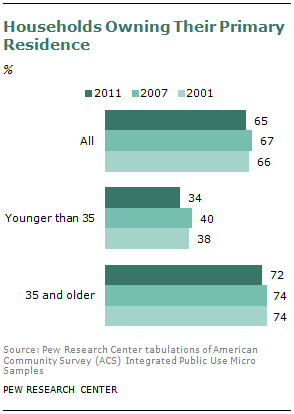
U.S. homeownership rates experienced a boom and bust over the 2000s similar to house prices (Gabriel and Rosenthal, 2011). By 2011, 65% of U.S. households owned their homes, a decrease from 66% in 2001.
Households headed by young adults experienced a greater decline in homeownership than households headed by those 35 and older. Among young adult households the homeownership rate fell 4 percentage points, from 38% in 2001 to 34% in 2011. Among households headed by those age 35 and older the homeownership rate fell only 2 percentage points, from 74% in 2001 to 72% in 2011.
 Available data cannot pin down the timing of home purchase decisions. Unlike age at first marriage, Census Bureau data do not reveal age at first home purchase. So it is not clear that young adult heads are postponing or forgoing homeownership. But homeownership declined among young adult households over the past decade, and fewer of them had mortgages. In an accounting sense, this is the first and foremost reason that indebtedness among young adult households declined.
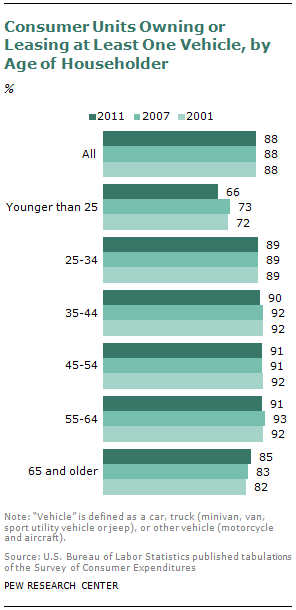
Similarly, households headed by young adults are less likely own a vehicle than in 2001. By contrast, vehicle ownership has not declined among older households and increased among households with heads age 65 and older. U.S. Bureau of Labor Statistics consumer expenditure data indicate that 72% of “consumer units” younger than age 25 owned or leased at least one vehicle in 2001.3 By 2011 only 66% of consumer units in the youngest age bracket owned or leased a vehicle. Changes in vehicle ownership from 2000 to 2011 were much more modest among older consumer units. Consistent with the decline in vehicle ownership, households headed by younger adults were much less likely in 2010 to have debt related to the purchase of a vehicle compared to 2001. The incidence of vehicle debt among households 35 and older did not decline much over the decade.
Households headed by young adults are less likely to own the big-ticket consumer durables that their peers of the same age possessed in 2001. They also do not have as much corresponding debt financing the acquisition of homes and cars.


