 As the nation’s aggregate outstanding student loan debt approaches $1 trillion (Federal Reserve Bank of New York, 2012), recently released Federal Reserve data on household finances reveal a sharp rise in the proportion of households having outstanding student loans. Nationally, in 2010 nearly one-in-five households (19%) owed student loans. In 1989 less than one-in-ten households had outstanding educational loans. As recently as 2007 only 15% of households had student debt, and thus amid the widely noted meltdown in the nation’s stock of wealth accompanying the Great Recession (Bricker et al., 2012), more households have student debt obligations.
The increase over 20 years in the share of households with education debt has occurred among most demographic and economic groups (see the first table in Appendix B). For example, among households by the age of the household head, more older as well as younger households had outstanding student debt in 2010 than in 1989. In regard to the rise in the propensity to have student debt since 2007, all age groups with the exception of households headed by those ages 55 to 64 experienced an increase. By 2010 40% of households headed by those younger than 35 had outstanding student debt, and 26% of households headed by those ages 35 to 44 had outstanding student loan obligations.
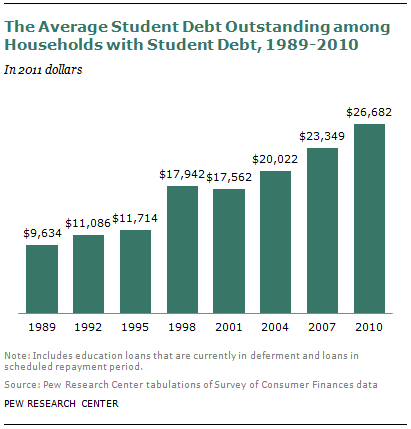
Among households owing student debt, the mean outstanding student loan balance was $26,682 in 2010. This average conceals considerable variation in the amount owed. The median amount owed was $13,410, and thus a majority of households paying student debt owe less than $14,000. More than three-quarters of households with student debt have balances less than $30,000. Yet, a nontrivial proportion of households paying student debt still owe at least $50,000. Around 10% of households paying down student debt have outstanding balances in excess of $62,000.
 The average outstanding student loan balance among households with student debt has been rising. As previously reported by the Federal Reserve, the average amount owed rose 14%, from $23,349 in 2007 to $26,682 in 2010 (Bricker et al., 2012).
 The increase in outstanding student debt since 2007 is being driven by several factors. First, college enrollment has increased sharply during the Great Recession and tepid recovery. In fall 2007, 18.2 million students were enrolled in college (Snyder and Dillow, 2012). By fall 2010, 21.0 million students were pursuing college, a 15% increase.
Second, the trend has been for college students to increasingly borrow to finance their education, and when they do borrow, to borrow greater amounts (Hinze-Pifer and Fry, 2010).
 In 2009-10, 51.1% of full-time, first-time undergraduate students had a student loan, an increase from the 43.5% of such students in 2006-07 (Snyder and Dillow, 2012). As far as amounts borrowed, the average public, four-year college graduate had accumulated $22,000 (in 2010 dollars) in debt upon receiving a bachelor’s degree in 2009-10, up from $20,500 (in 2010 dollars) in 2006-07 (College Board Advocacy and Policy Center, 2011).4
