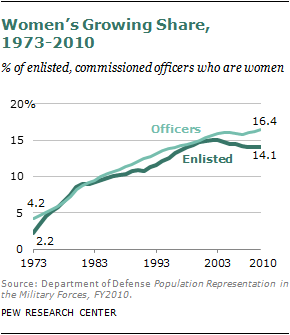
 The numbers of women on active duty in the military have risen dramatically since the beginning of the all-volunteer force. The number serving as enlisted personnel has grown from 42,278 in 1973 to 166,729 in 2010, and the number serving as commissioned officers has increased from 12,750 to 35,341 over that same period. At the same time, the size of the military as a whole has been declining steadily. In 1973, there were more than 1.9 million enlisted personnel; today, there are less than 1.2 million.
 Women in this decade have made up a much greater share of the active-duty military than they have at any time in U.S. history. Among the ranks of the enlisted, 14% are now women (up from 2% in 1973), and among commissioned officers, 16% are now women, compared with 4% in 1973.
As the share of women in the military increases, so does the share of veterans who are women. The 2010 Current Population Survey estimates that there are just over 22 million veterans, almost 1.8 million of whom are women (8%); and among the estimated 2.2 million post-9/11 veterans, more than 400,000 (19%) are women.
Today’s women veterans have served in every era dating back to World War II, when women in the Women’s Army Corps (WAC) and other voluntary divisions served in positions other than nurses for the first time.
The majority of female veterans (53%) served sometime during the quarter century between Vietnam and Sept. 11, 2001. Of these women, 27% served between the end of the Vietnam conflict and July 1990, and 26% served between August 1990 and 9/11. Some 23% of women veterans have served in the post-9/11 era.
Women who serve in the military today differ in some ways from the men that they serve alongside. The current active-duty female force is more racially diverse than the male force. Today’s military women are less likely than men to be married and less likely to serve in a combat zone. However, in many ways the experiences they have are similar to their male counterparts: they are just as likely to be officers and they have similar experiences re-entering and adjusting to civilian life once discharged.
Race and Ethnicity of Military Women
 There are a few key demographic differences between women and men in the military. The most prominent among these is the racial compositions of the two groups. While 71% of active-duty men are white (including white Hispanics), only about half of active-duty women (53%) are white. The share of white women in the military is also significantly smaller than their proportion in the civilian female population ages 18-44 (78%).
More than three-in-ten (31%) military women are black (including black Hispanics). This is almost twice the share of active-duty men who are black (16%), as well as more than twice the proportion of civilian women ages 18-44 who are black (15%). In addition, more women in the active-duty force than men in the active-duty force and civilian women ages 18-44 are of mixed racial background or some other race.3
The share of Hispanics among women and men in the armed forces is similar (13% vs. 12%, respectively), and the share of military women who are Hispanic is smaller than that of Hispanic women ages 18-44 in the U.S. civilian population (16%). But the number of Hispanics enlisting in the active-duty force each year has risen significantly over the last decade. In 2003, Hispanic women and men made up 11.5% of the new enlistees to the military; just seven years later, in 2010, they made up 16.9% of non-prior service enlisted accessions.4
Marriage Rates of Active-Duty Women
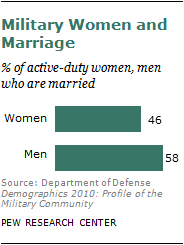
 Among active-duty women in the military, being married is less common than it is for active-duty men. Only 46% of active-duty women are married compared with 58% of active-duty men.
While military women’s marriage rate is the same as that of their civilian counterparts, men in the military are much more likely than civilian men to be married. Fully 58% of men in the active-duty military are married, while only 48% of civilian men ages 18-44 are married. For women, 46% of both active-duty military women and civilian women ages 18-44 are married.
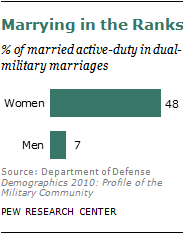
 Among those active-duty women who are married, a striking difference arises between military women and men. Almost half of all married military women (48%) have wed a fellow service member, while the share of men in dual-military marriages is only 7%.
Not only are active-duty women more likely to be unmarried, but they are also more likely than active-duty men to be single parents. While 12% of military women are single mothers, only 4% of military men are single dads.
Where and How Women Serve
 In addition to the demographic differences, military women and men differ in their choice of service branch, occupation and combat experience.
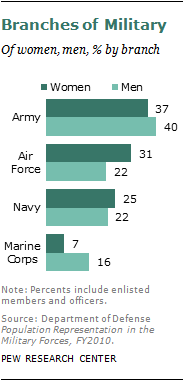
Similar shares of men and women currently serve in the Army, which is the largest active-duty branch of the military, and in the Navy. But women are more likely than men to be in the Air Force; nearly one-third (31%) of military women are in the Air Force compared with 22% of men.
On the other hand, women are much less likely than men to be in the Marine Corps — only 7% of military women are Marines, compared with 16% of men. In other words, less than half as many women as men joining the military choose the Marines.
While the overall number and share of women and men in the Air Force and Marines differ, of those women and men who are part of these branches, their proportions among the top ranks are similar.
In the armed forces as a whole, a slightly greater proportion of women than men are commissioned officers (17% vs. 15%, respectively). This advantage largely plays out in the Army, where 18% of women are commissioned officers, compared with 13% of men. The proportions of commissioned officers among men and women are equal in the Air Force and Navy, and nearly equal in the Marine Corps (9% vs. 10% of men).
Though women and men advance in the military at similar rates, there are differences in their occupational roles. Most notably, female veterans are much less likely than their male counterparts to have served in a combat or war zone during their time in the service (15% of all women veterans vs. 35% of men).5
This mismatched experience arises largely because of the differences among occupational roles for military women and men. Occupations in infantry are dominated by men: while 19% of servicemen are in the infantry, gun crews or are seamen, only 3% of servicewomen are in these roles. The ongoing prohibition against women serving in ground units where combat is the primary mission plays a part in the skewed distribution of these infantry roles.6
In the early 1990s, the Department of Defense changed its policies in a way that allowed women to serve in a greater variety of combat-related roles, such as flying in combat aircraft and serving on combat ships. This has led to a sharp rise in the share of female veterans who have served in combat zones — from 7% in pre-1990 eras, to nearly a quarter (24%) among those who served since 1990.
There are several other differences in the occupational distribution of men and women in the military.
Active-duty women are much more heavily concentrated in administrative and medical roles than are active-duty men. A plurality of women in the military (30%) are in administrative positions, compared with only 12% of men. And while only 6% of men in the military hold medical roles, 15% of women have these types of jobs.
Occupational roles in the electrical field are the only jobs other than infantry that are overwhelmingly dominated by men. While 22% of men are in electrical positions, only 12% of women serve the same roles.


