Frustrated with your job? You might consider working for yourself. Self-employed adults are significantly more satisfied with their jobs than other workers. They’re also more likely to work because they want to and not because they need a paycheck.
But don’t count on becoming financially secure if you become your own boss. Self-employed men and women have virtually identical family incomes as other workers but they feel more financial stress, according to a recent survey by the Pew Research Center Social & Demographics Trends project.
 Still, they like their jobs. Nearly four-in-ten self-employed workers (39%) say they are “completely satisfied” with their jobs, compared with 28% of all wage or salaried employees.1 And only 5% of all workers who are their own bosses say they are dissatisfied with their employment situation, half the proportion of other workers who are dissatisfied.
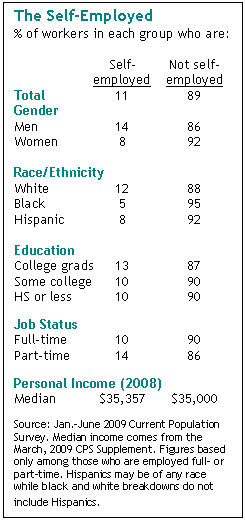
About 11% of all working adults ages 16 and older are self-employed, according to data collected by the federal government’s Current Population Survey.2 Their jobs vary widely, from small business owners and consultants to fishing guides and freelance writers. Included in the ranks of the self-employed are private contractors, artists, construction workers, day laborers, farmers and agricultural workers, as well as doctors, lawyers and accountants who practice alone.
 Why do they work? Money is one reason — but it’s far less of a factor for the self-employed than for other workers. Nearly a third of the self-employed (32%) say the main reason they work is because they want to, compared with 19% of wage and salary workers. By the same token, the self-employed are less likely than other workers to say they hold a job because they need the money (50% vs. 38%). They also place a higher value on the intangible psychological benefits of working such as feeling useful and productive, and are more likely to say they are working to help “improve society” (55% vs. 46%).
While being your own boss may have many rewards, a hefty income isn’t necessarily one of them. According to Current Population Survey data, the median annual personal income of self-employed workers in 2008 was about $35,357 — only a few hundred dollars higher than the earnings of wage and salary workers. But even though they earn about as much as other workers, the self-employed struggle more financially: fully four-in-ten in the Pew Research survey say they just make ends meet or fall short, compared with less than a third of all wage and salary employees. This survey does not directly answer why the self-employed feel disproportionately stressed; one reason may be that self-employed workers have to pay for benefits such as health care that many employees receive from their companies.
The following profile of the self-employed draws on data from two sources that measure this group in different ways. Data from the monthly Current Population Survey is used to provide estimates of the percentage of self-employed in the workforce and to chart trends in self-employment. The Pew Research survey measures work motivation and economic security among the self-employed, and compares these results with responses to the same questions by wage and salaried workers. A total of 1,040 adults ages 16 and older who are employed full or part-time were interviewed July 20-Aug. 2, 2009 for this survey, including 254 self-employed workers and 885 who are wage and salaried workers.3
A Demographic Profile of the Self-Employed
 In 1948 the Current Population survey reported that 18.6% of all full-time and part-time workers ages 16 and older were self-employed.4 Over the ensuing six decades, the percentage of self-employed workers has drifted slowly downward. Today, about 11% of the job force is self-employed and that percentage has been more or less unchanged throughout this decade. While the proportion of self-employed workers has ticked up slightly during previous recessions, it has not budged during the current downturn, likely because a disproportionate share of the self-employed work in the hard-hit construction industry.
Pew Research survey results and government data show that older adults, men and whites are significantly more likely than younger people, women and minorities to be self-employed.
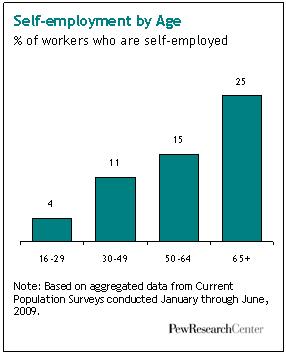
Older workers in particular are more likely to work for themselves. Overall, only about 4% of workers younger than age 30 are self-employed. The percentage of self-employed workers increases dramatically among older age groups, growing nearly four-fold to 15% among those ages 50 to 64 and rising further to 25% among workers 65 or older, according to the Current Population Survey.
 Labor force characteristics differ dramatically between younger and older self-employed workers. The Pew Research survey found that up until age 50, about three-quarters of the self-employed had full-time jobs (77%). But among those self-employed workers age 50 or older, a bare majority (53%) works full-time, while nearly as many (47%) are part-time.
Among working adults, men are more likely than women to be self-employed (14% vs. 8%). Through the 1990s, women had been slowly closing this gap. But the proportion of working women who are self-employed has been largely unchanged in recent years; if anything, it may have declined from 1995 when 9% of all working women were self-employed. Still, the share of women who work for themselves is currently twice as large as it was in 1976 when only 4% were self-employed.
Whites (12%) also are more likely than blacks (5%) or Hispanics (8%) to be self-employed. Those with a college degree also are slightly more likely than those who have not graduated from college to be working for themselves.
Contrary to some stereotypes, foreign-born workers are no more likely to be working for themselves than native-born Americans. Overall, about 11% of workers in each group report they are self-employed.
Why the Self-Employed Work
Self-employed adults are more likely than others to be working for the intangible psychological benefits that come from a job. To be sure, a paycheck is important to the self-employed — eight-in-ten said a big reason they worked is to support themselves and their families. But money is less of a motive to work for these workers than it is to wage and salaried employees.
 The Pew Research survey found that a plurality of self-employed workers (38%) but a significantly larger share of wage and salaried workers (50%) say they mainly work to collect a paycheck — a gap that exists regardless of family income or age. At the same time, nearly a third of self-employed adults (32%) say they work mainly because they want to work compared with 19% of other workers.
Other factors clearly motivate those who work for themselves. When asked the big reasons they worked, the self-employed are more likely than salary or wage employees to say they work in order to live independently (84% vs. 76%), feel productive (75% vs. 67%) and “to help improve society” (55% vs. 46%). They also are more likely to work to give themselves “something to do” (50% vs. 39%) and to be with other people (43% vs. 34%).
At the same time, they’re far less motivated to be working to secure health benefits (39% vs. 60%), and are no more likely to say a big reason why they are working is to qualify for Social Security or a pension.
 Significantly, older workers are disproportionately likely to work for reasons other than money.5 Could the “intangibles gap” exist simply because older workers, many of whom collect Social Security or a pension check, are more likely to be self-employed?
The answer appears to be no. Regardless of their age, self-employed and wage or salaried workers differ in their motivations for working. According to the survey, self-employed workers are consistently more likely to be motivated by factors other than money.
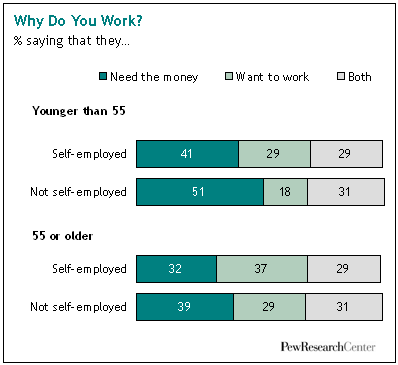
For example, employed workers younger than age 55 are more likely than similarly aged wage and salaried workers to say they work because they want to, not because they need the money (29% vs. 18%). Among all workers age 55 and older, the gap is eight percentage points, with the self-employed again more likely to say they work for reasons other than a paycheck.
When asked the big reasons they worked, the self-employed, regardless of age, are consistently more likely to say they hold a job because they want to improve society, spend time with others, feel productive and live independently.
Among workers younger than 55, nearly six-in-ten (58%) of the self-employed say they work to help society compared with 49% of younger wage and salary workers who say the same thing. An even greater share of self-employed workers 55 and older also says they work for to better the world (48% vs. 34%).
Perhaps surprisingly, self-employed workers younger than 55 are the group most likely to value the social aspects of their job. For example, 47% of the self employed younger than 55 say they work because they want to be with other people compared with 34% of younger wage and salaried employees.
When it comes to job security versus a high paycheck, the self-employed are more likely than other workers to value a high income over job security, other factors being equal. More than four-in-ten self-employed adults (45%) say they would favor a job that promised a larger paycheck over one with more job security, a view shared by only a third of other workers.
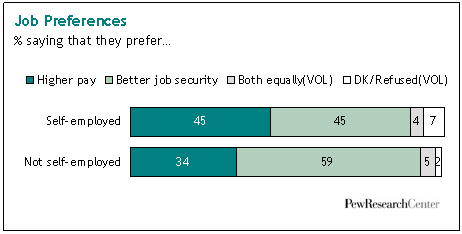
Along the same lines, about six-in-ten wage and salary employees say they would prefer a job that offers better job security over a higher-paying position. Fewer than half (45%) of all self-employed workers opt for security.
But do the self-employed strike gold working on their own? As the next section shows, some do — but most do not.
Higher Job Satisfaction but More Financial Stress
No matter how income is measured the result is the same: the self-employed make about the same amount of money as do other workers. According to the Current Population Survey data, the median annual personal income of self-employed workers in 2008 was $35,357, while the median for wage and salaried workers is $35,000.
Similarly, the Pew Research survey asked respondents for their overall family incomes — a total that includes the earnings of spouses — and found that the median family incomes of the self-employed and other workers are identical: $62,500.6
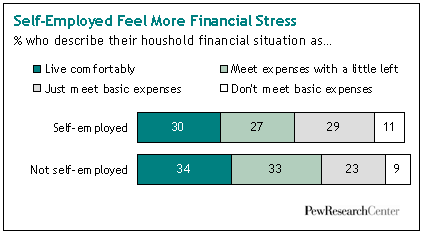 But another question suggests that the self-employed aren’t faring quite as well financially as other workers. When asked to describe their household’s financial situation, fully four-in-ten of all self-employed workers (40%) say their family either falls short of meeting their basic living expenses or are barely getting by. In contrast, only about a third (32%) of all wage and salary workers report being similarly stressed.
Why do the self-employed feel more stress? The survey cannot answer whether this difference is because self-employed workers must pay for such benefits as health insurance out of their own pockets or some other factor.
In short, caveat emptor: Being your own boss seems to offer a lot of upsides. But financial security isn’t one of them.


