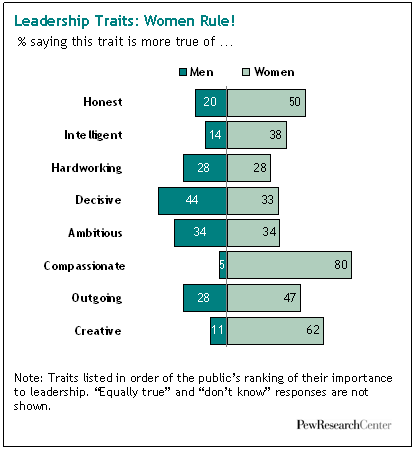
Americans believe women have the right stuff to be political leaders. When it comes to honesty, intelligence and a handful of other character traits they value highly in leaders, the public rates women superior to men, according to a new nationwide Pew Research Center Social and Demographic Trends survey.
 Nevertheless, a mere 6% of respondents in this survey of 2,250 adults say that, overall, women make better political leaders than men. About one-in-five (21%) say men make the better leaders, while the vast majority — 69% — say men and women make equally good leaders.
The paradox embedded in these survey findings is part of a wider paradox in modern society on the subject of gender and leadership. In an era when women have made sweeping strides in educational attainment and workforce participation, relatively few have made the journey all the way to the highest levels of political or corporate leadership.
Why not? In the survey, the public cites gender discrimination, resistance to change, and a self-serving “old boys club” as reasons for the relative scarcity of women at the top. In somewhat smaller numbers, respondents also say that women’s family responsibilities and their shortage of experience hold them back from the upper ranks of politics and business.
What the public does not say is that women inherently lack what it takes to be leaders. To the contrary, on seven of eight leadership traits measured in this survey, the public rates women either better than or equal to men.
For example, half of all adults say women are more honest than men, while just one-in-five say men are more honest (the rest say they don’t know or volunteer the opinion that there’s no difference between the sexes on this trait). And honesty, according to respondents, is the most important to leadership of any of the traits measured in the survey.
The next most important leadership trait, in the public’s view, is intelligence. Here again, women outperform men: 38% of respondents say women are smarter than men, while just 14% say men are smarter, and the remainder say there’s no difference between the sexes.
 Men and women tie on two of the next three traits on the public’s ranking of leadership qualities measured in this survey — hard work and ambition. Men prevail over women on decisiveness (their lone “victory” in the battery of eight traits), with 44% of respondents saying that men are more decisive and 33% saying women are.
Finally, women have big leads over men on the last three traits on the public’s rankings of the eight items measured: being compassionate (80% say women; 5% say men); being outgoing (47% say women; 28% say men) and being creative (62% say women; 11% say men).
For anyone keeping score, that’s women over men by five to one, with two ties, on eight traits, each of which at least two-thirds of the public says is very important or absolutely essential to leadership. Notably, nearly all of these gender evaluations are shared by men as well as women, though the margins are more heavily pro-woman among female respondents than among male respondents.
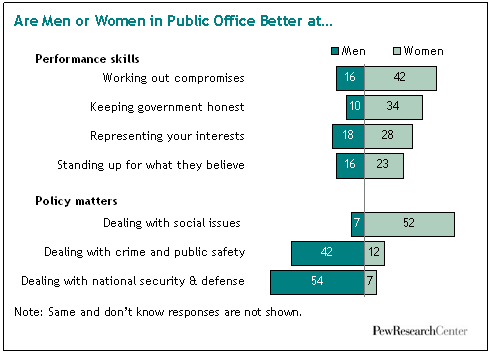
The survey also asked respondents to assess whether men or women in public office are better at handling a range of policy matters and job performance challenges. On the policy front, women are widely judged to be better than men at dealing with social issues such as health care and education, while men have a big edge over women in the public’s perception of the way they deal with crime, public safety, defense and national security.
As for job performance skills, women get higher marks than men in all of the measures tested: standing up for one’s principles in the face of political pressure; being able to work out compromises; keeping government honest; and representing the interests of “people like you.”
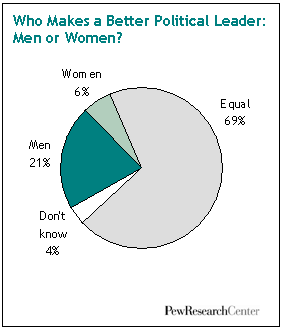 Overall, however, women emerge from this survey a bit like a sports team that racks up better statistics but still loses the game — witness the tiny 6% sliver of the public that says women generally make better political leaders than men.
To be sure, the fact that such a large majority of respondents (69%) say that women and men make equally good political leaders is itself a measure of the profound changes in women’s role in society that have taken place over the past several decades.
Women make up 57% of all college students, about half of all law and medical school students, and more than four-in-ten students who earn masters degrees in business. They make up 46% of the total private sector workforce and 38% of all managers.
However, it’s still lonely for women at the very highest rungs of the corporate and political ladder. Women are just 2% of the CEOs of the nation’s Fortune 500 companies. In the political realm, they make up just 17% of all members of the U.S. House of Representatives; 16% of all U.S. senators; 16% of all governors; and 24% of all state legislators. Internationally, the U.S.ranks in the middle range — 85th in the world — in its share of women in the lower house of its national legislative body.
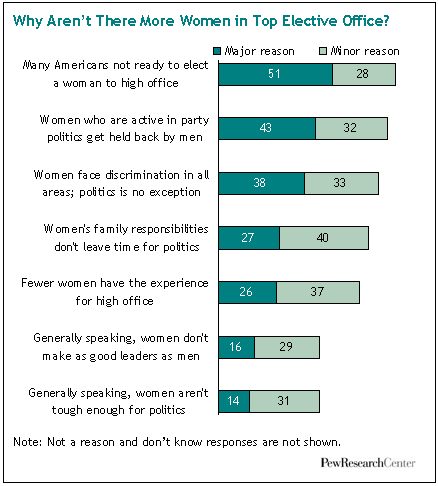 Asked what accounts for this slow movement toward gender parity in top political positions, about half (51%) of all survey respondents say a major reason is that Americans simply aren’t ready to elect a woman to high office; more than four-in-ten (43%) say a major reason is that women who are active in politics are held back by men, and 38% say a major reason is that women are discriminated against in all realms of society, and politics is no exception. These are the three most prevalent choices among seven possible explanations presented in the survey.
Next in the pecking order of explanations is the time pressure that comes with trying to balance work and family; 27% of the public cites this as a major reason there aren’t more women leaders in politics. Some 26% say that a big reason is that women don’t have the experience required for higher office. The least common explanations — chosen as a major reason by just 16% and 14% of respondents, respectively — are that women don’t make as good leaders as men and that women aren’t tough enough for politics.
 An Experiment to Test for Hidden Gender Bias
It’s possible that in a survey of this nature, some respondents with negative or biased attitudes do not report their true feelings because they don’t want to appear out of sync with prevailing social norms.
To test for hidden gender bias, the Pew Research Center did a second survey, this one conducted online with a different methodology, a different set of questions and a different group of respondents.
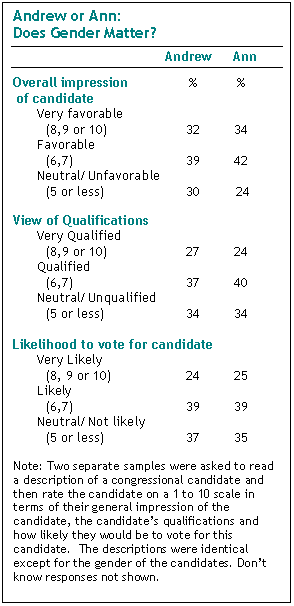
In this experiment, two separate random samples of more than more than 1,000 registered voters were asked to read a profile sent to them online of a hypothetical candidate for U.S. Congress in their district. One random sample of 1,161 respondents read a profile of Ann Clark, described as a lawyer, a churchgoer, a member of the
local Chamber of Commerce, an environmentalist and a member of the same party as the survey respondent. They were then asked to indicate what they liked and didn’t like about her, whether they considered her qualified and whether they were inclined to vote for her. There was no indication that this was a survey about gender or gender bias.
A second random sample of 1,139 registered voters was asked to read a profile of Andrew Clark, who — except for his gender — was identical in every way to Ann Clark. These respondents were then asked the same questions: What did they like and not like about Mr. Clark? Was he qualified? Were they inclined to vote for him?
The results were clear: Gender didn’t matter. Ann Clark and Andrew Clark got about the same number of “votes” from their respective samples. The study found that about a third of all voters had a very favorable impression of Ann Clark (giving her a rating of 8, 9 or 10 on a scale that ran from 1 to 10)—and virtually the same proportion held Andrew Clark in equally high regard (34% vs. 32% respectively, with average ratings of 6.7 and 6.6 out of 10).
Similarly, both samples viewed their respective candidates as nearly equally prepared for the job. Some 24% rated Ann as highly qualified, compared with 27% for Andrew. (The average ratings were even closer: 6.3 for Andrew vs. 6.2 for Ann).
And when it came to the bottom line, virtually identical proportions of voters said they were very likely to vote for Ann as said they were very likely to vote for Andrew (25% vs. 24%, with identical average ratings of 6.2 on the 1 to 10 “likeliness to vote for” scale).
The Paradox in Public Attitudes
Taken together, the findings of the experimental online survey and the more comprehensive telephone survey present a complex portrait of public attitudes on gender and leadership.
On the one hand, the public asserts that gender discrimination against women and the public’s resistance to change are key factors holding women back from attaining high political office. But at the same time, the public gives higher marks to women than to men on most leadership traits tested in this survey — suggesting that, when it comes to assessments about character, the public’s gender stereotypes are pro-female.
Moreover, a separate survey designed specifically to probe for hidden gender bias against women in voters’ assessments of candidates for Congress finds no evidence that such bias exists.
Is there a way to resolve — or, at the very least, better understand — this apparent paradox? Several possible explanations suggest themselves.
It could be that had this survey measured a broader range of leadership traits, the public’s evaluations would have been more pro-male. Over many decades, numerous controlled experiments in work-related settings by psychologists and management researchers have found that participants see men as more dominant and assertive and women as more socially-skilled and egalitarian — and that they value the male traits more highly in top leadership positions. However, studies have also shown that these perceived gender differences on some key leadership traits are not as strong now as they were in the 1970s and 1980s.
Or it could be that the key factors that explain women’s relatively slow march into top leadership positions in politics have less to do with the public’s gender stereotypes and more to do with other obstacles. For example, a number of recent studies have shown that women do about as well as men once they actually run for office, but that many fewer women choose to run in the first place.
One possible explanation for this gender gap at the “starting line” of political campaigns is that party leaders are reluctant to seek out women candidates, especially for highly competitive races. A recent Brookings Institution study puts forward another possible explanation. It suggests that women may be constrained by their own shortfall in political ambition– which, the study theorizes, is the sum of many parts: they have more negative attitudes than men about campaigning for office, they under-value their own qualifications for office; and they are more likely than men to be held back by family responsibilities.
The Pew survey was conducted by telephone from June 16 through July 16, 2008 among a nationally representative sample of 2,250 adults, including 1,060 men and 1,190 women. The margin of error is plus or minus 2.3 percentage points for the full sample. For a complete description of the survey methodology, see page 44.
 Other key findings from the survey:
• Negative Gender Stereotypes: In addition to asking about the eight leadership traits, the survey asked about four traits that are often viewed in a negative light. By a lopsided margin, respondents say that women (85%), not men (5%), are the more emotional sex, and by a two-to-one margin they say women (52%) rather than men (26%) are more manipulative. On the other side of the ledger, some 70% of respondents say men are the more arrogant sex. And 46% of respondents say men are the more stubborn gender, compared with 32% who say that about women.
• Gender Solidarity: In this survey, women see themselves in a more favorable light than men see women. Likewise, men seen themselves in a better light than women see men. However, for men, gender solidarity goes only so far. Overall, they give their gender the better ratings on just five of the 12 traits (decisiveness; hard work; ambition; not being emotional; not being manipulative) and they give themselves inferior ratings on seven (honesty; intelligence; compassion; creativity; being outgoing; being stubborn; being arrogant). By contrast, while women say they are more emotional and more manipulative than men, they give themselves higher marks than men on the 10 other traits measured.
• Gender and Race: Of all demographic groups, black women are distinctive in the degree to which they say women are superior to men in their evaluations of character traits. Nearly eight-in-ten (78%) black women (compared with 51% of white women and 50% of all adults) say women are more honest than men. About two-thirds (65%) of black women (compared with 37% of white women and 38% of all adults) say women are smarter than men. And about half (49%) of black women (compared with 33% of white women and 28% of all adults) say women are more hardworking than men.
• Twice as Hard; Half as Far: The feminist rallying cry that women have to work twice as hard to get half as far as men in their careers finds some statistical support from this survey, as least with regard to leadership evaluations. Survey respondents who rate men better than women on key character traits have a sharply increased likelihood of saying that men make better political leaders than women. But respondents who rate women better than men on these same traits have only a slightly increased likelihood of saying women make better leaders than men.
• It’s a Man’s World: By a ratio of nearly two-to-one, Americans say that, all things considered, men rather than women have a better life in this country. Women believe this in greater numbers than men do, and younger and middle-aged adults believe it in greater numbers than older adults do. The view that men have the better life than women is not as strong now as it was 15 years ago, when the public said by a ratio of about three-to-one that men had the better life. However, still farther back in time, attitudes were much different. In 1972, during the early days of the modern gender revolution, slightly more adults said women had the better life than said that about men.
• Generational Differences Among Women: Older women are more inclined than younger women to see the need for more social change to ensure that women have equal rights; seven-in-ten women ages 50 and over say more change is needed, a view shared by just 53% of women ages 18-29. At the same time, younger and middle-aged women are more inclined than older women to say that men rather than women have the better life in this country.
• Discrimination and Equal Rights: A majority of adults (57%) say the nation needs to continue to make changes to give women equal rights with men. A similar majority (54%) says discrimination against women is either a serious or somewhat serious problem in society. However, a bigger majority (63%) says that discrimination against blacks is a serious or somewhat serious problem.
• Admiration for Hillary Clinton: The survey asked no questions about Sen. Hillary Clinton or the 2008 presidential campaign. However, in answer to an open-ended question, Clinton and Sen.Barack Obama were each named by 13% of respondents as the political figure in the U.S. that they admire most. President Bush was the third most frequently mentioned figure, named by 7% of respondents. Women are more than twice as likely as men to name Clinton as the figure they admire most; and Hispanics are much more likely than blacks and somewhat more likely than whites to name her as the figure they admire most.
About the Survey
Results for this survey are based on telephone interviews conducted with a nationally representative sample of 2,250 adults living in the continental United States. A combination of landline and cellular random digit dial (RDD) samples was used to represent all adults in the continental United States who have access to either a landline or cellular telephone. A total of 1,500 interviews were completed with respondents contacted by landline telephone and 750 from those contacted on their cellular phone. The data are weighted to produce a final sample that is representative of the general population of adults in the continental United States.
- Interviews conducted from June 16 to July 16, 2008
- 2,250 interviews
- Margin of sampling error is plus or minus 2.3 percentage points for results based on the total sample at the 95% confidence level.
- When complete results of a question are presented, percentages may not add to 100% due to rounding. Trend data from other surveys cited in this report may use slightly different rounding rules.
- Note on terminology: Whites include only non-Hispanic whites. Blacks include only non-Hispanic blacks. Hispanics are of any race.
Survey interviews conducted under the direction of Princeton Survey Research Associates International. Interviews conducted in English or Spanish.
Read the full report for more details.


