17% of the Middle Class; 9% of the total population
On virtually every key measure of social stature and attainment—income, education, home ownership and even health, members of the Struggling Middle are lagging behind other middle class Americans. Women significantly outnumber men in this group and minorities are disproportionately represented, though whites still constitute the majority of the Struggling Middle. It is the smallest of the four classes: 17% of middle class identifiers and 9% of all adults fall into this group.
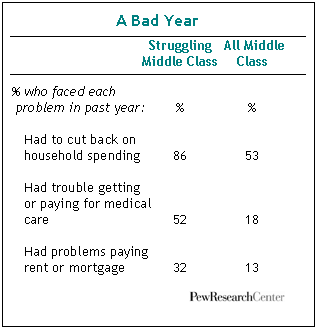
 In some respects, many members of the Struggling Middle appear to have more in common with the lower classes than with other self-identified middle class Americans. A 58% majority have family incomes of less than $20,000 a year—easily the lowest income of any of the four middle-class groups. It’s no surprise, then, that they’re the most likely to report they had trouble paying their bills. They’re the second least likely to be employed full-time; only the Satisfied Middle, a group in which a majority are either retirees or students, contains as few full-time workers. They’re the only group in which a majority does not own their homes. These self-described middle class Americans also had the most trouble paying their rent or mortgage payments last year.
Nearly half (47%) rank themselves on the bottom rungs of the quality-of-life ladder, 20 points higher than for the middle class as a whole. In terms of their attitudes, they are the most politically liberal but socially conservative of the four groups, broadly favoring government assistance to help the needy while opposing gay marriage. They also are the most likely of the four groups to agree that it would be better if women returned to their traditional roles.
Who They Are
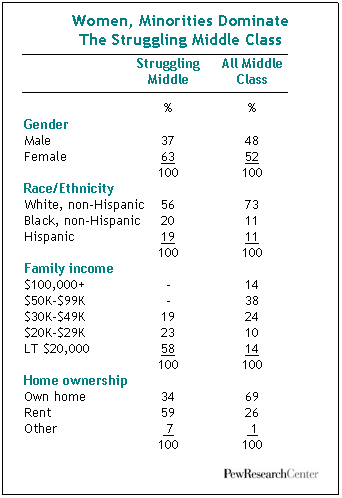
Money—or more precisely, the lack of it—defines these struggling Middle Class Americans. Even though they identify broadly with the middle class, fully 30% have family incomes of less than $10,000, and nearly six-in-ten have total family incomes of less than $20,000 a year. No one in this group earns more than $50,000.
Those income statistics are even more striking when they are compared with those in the Pew Researchsurvey who say they identify with the lower classes. Among these most disadvantaged Americans, fewer than a third have family incomes of less than $20,000, about half the proportion of those middle class Americans who fall into the Struggling Middle (30% vs. 58%).
 These middle class identifiers defy the middle class stereotype in two other ways. While a majority of those in the middle class are homeowners, this is the only group in which the majority does not own a home. Six-in-ten (60%) are renting, more than double the proportion of the middle class as a whole, while just a third (34%) are own their own homes. Also, while fully half (53%) say it’s “very important” to them to be married, they are the least likely to be married—fewer than a quarter are married (23%), less than half the proportion of all middle class Americans (53%).
Women dominate this group: 63% of the Struggling Middle are female, the largest proportion of any of the four groups. The Struggling Middle contains the largest proportion of minorities: 20% are black and 19% are Hispanics while 56% are white. The Struggling Middle includes the largest proportion of non-citizens (14%), as well as adults born in another country (21%).
The Struggling Middle is also disproportionately young and represent the flip side of the more upbeat and successful young adults in the Satisfied Middle. Slightly more than a third (35%) of those in this group are under the age of 30, compared with 22% of all adults who identify as middle class. Those in this group are the least-well educated of the four groups. Only 8% are college graduates, while more than three-in-ten (31%) did not graduate from high school and another 45% did not go on to college after they graduated from high school.
Life has been tough and may get tougher for members of the Struggling Middle. Nearly a third (32%) had problems paying their rent or mortgage, more than double the proportion for the middle class as a whole. Nearly three-in-ten (28%) were laid off or lost their job, double the proportion of the middle class as a whole. Fully half (52%) say they had problems getting or paying for medical care for themselves or their families in the past year, more than double the proportion in the middle class as a whole. That result is particularly troubling in light of another finding: Only 15% rate their health as “excellent’ while 36% say it is “only fair” or “poor”—more than double the proportion of the middle class as a whole and easily the largest share of any group that view their health so negatively.
 And they fear there’s more trouble ahead. More than seven-in-ten (72%) predict they’ll have difficulty paying their bills in the coming year, and an even larger proportion say they will have difficulty saving money for the future. They also are the most likely to say they may be laid off in the coming year, a worry expressed by 30% of these struggling Middle Class Americans.
Politically, Democrats outnumber Republicans 3-1 in the Struggling Middle (42% vs. 15%). That Democratic advantage is diminished, however, by the fact that more than half (53%) say they are not registered to vote.
What They Think
Nearly half (47%) rank themselves on the bottom rungs of the quality-of-life ladder—the largest proportion of any of the four groups who are so dissatisfied with their lives—while only a quarter (24%) rate themselves at the top.
 But hope springs eternal: fully 40% say they expect that their children will live much better than they do; only the Satisfied Middle comes close to matching their optimism for their children (37%).
Beset with financial problems and facing somewhat limited prospects, members of the Struggling Middle are the most likely of the four groups to accept the proposition that success is pretty much determined by forces outside one’s control; fully half (50%) agree, compared with about a third of the middle-class in general.
In key ways, this is the most economically liberal of the four groups but socially the most conservative. A 57% majority “completely agree” that the “government should guarantee health care to every citizen,” compared with 40% of the middle class as a whole. At the same time, nearly four-in-ten agree that “women should return to their traditional roles in society,” a view shared by less than a quarter of the overall middle class.
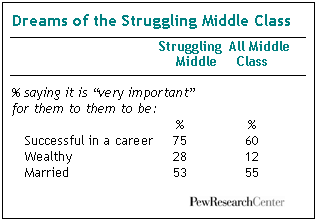
Those in the Struggling Middle also dream of a better life for themselves as well as their children. They are by far the most likely to rank being successful in a career as a top life priority. Fully three-quarters say job success is “very important” to them, compared with 60% of all middle class adults. Significantly, this is fully 20 percentage points greater than the proportion of those in the most accomplished group, the Top of the Class, who valued career success as highly (75% vs. 54%). This group also is the most likely to say that “being wealthy” is very important to them, a view shared by 28% of the Struggling Middle but 12% of the middle class as a whole.


