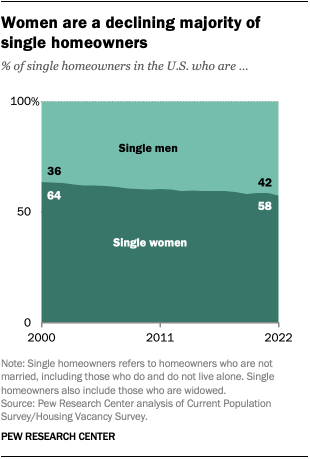
Recent news stories have highlighted the fact that single women in the United States own more homes than single men do. Over the long term, however, that gap is narrowing, according to recently released U.S. Census Bureau data.
Pew Research Center undertook this analysis to better understand the gender gap in homeownership among single Americans and put it in broader historical context.
The counts of single households and single homeowners are based on the Current Population Survey/Housing Vacancy Survey. The Census Bureau publishes these figures in historical table 15a.
The Census Bureau defines a “single household” as one headed by an unmarried person, regardless of who else is living in the household.
The gender pay gap among employed single heads of household is based on an analysis of the 2019 Current Population Survey monthly outgoing rotation group files (IPUMS). The calculation is based on the median hourly earnings of part-time and full-time workers. The 88% figure is not for all workers but for workers who are single household heads.
The median income and wealth figures use the 2019 Survey of Consumer Finances (SCF) collected by the Federal Reserve Board. The SCF is a triennial survey and 2019 is the most recent survey year available.

In 2022, single women owned 58% of the nearly 35.2 million homes owned by unmarried Americans, while single men owned 42%.
In 2000, by comparison, single women owned 64% of the almost 25 million homes owned by unmarried Americans. Single men owned 36%.
So what explains the homeownership edge that single women have over single men? And why has the pattern shifted in recent years?
The homeownership edge that single women have held over single men is due more to their numbers than their economic power. This is especially true among older Americans, who are more likely than younger people to own a home. About 70% of single household heads ages 65 and older own their home, compared with 44% of single household heads ages 35 to 44.
Among households headed by an unmarried person age 65 or older, about 6 million more are headed by women than men. Looked at another way, a third of all single women household heads were at least 65 years old in 2022, while only 22% of single men household heads were in that age group. This may be because women in the U.S. tend to live longer than men. (Single Americans in this analysis include those who are widowed, who tend to be in older age groups.)

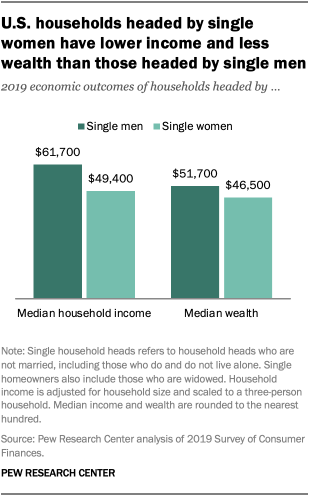
In most age groups, households headed by single women have lower homeownership rates than those headed by single men – a finding that aligns with economic considerations. Among all employed single household heads, women earned about 88% of what men earned in 2019. The median income of households headed by single women ($49,400) was considerably lower than that of households headed by single men ($61,700). Households headed by single women also have slightly less wealth, or net worth, than those headed by single men.
A basic reason the gender gap in homeownership among single Americans has narrowed in recent years is that single women no longer so heavily outnumber single men among older household heads. Today, women only account for about two-thirds of single household heads ages 65 and older, down from three-quarters in 2000. Again, this may reflect changes in life expectancy; women tend to live longer than men, but the gap has narrowed over time.


