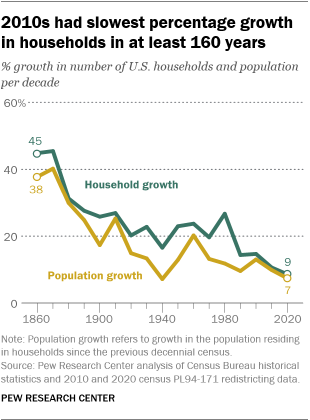
Growth in the number of U.S. households during the 2010s slowed to its lowest pace in history, according to a Pew Research Center analysis of newly released 2020 census data.
The 2020 census counted 126.8 million occupied households, representing 9% growth over the 116.7 million households counted in the 2010 census. That single-digit growth was more anemic than the prior record low percentage growth of households (11%) during the previous decade, as shown in the 2010 census. The decennial census has counted the number of U.S. households on a consistent basis dating back to 1850.
From 2010 to 2020, the number of households increased by 10.1 million – fewer than in any decade from 1950 to 2010. For example, in the 1970s, when the adult population was much smaller, the U.S. added 16.9 million households.
After the housing bust and Great Recession of 2007-2009, the U.S. experienced the longest economic expansion on record. Rising employment and incomes might be expected to yield a sustained increase in household formation and in more household growth than during the prior decade, but this analysis finds that has not been the case. The 2020 census figures provide an opportunity to benchmark the growth of households in the 2010s in comparison to prior decades.
The analysis relies on two different Census Bureau data collections.
The counts of households and the population residing in households are based on the decennial census. The 2020 and 2010 figures are from census Redistricting Data (Public Law 94-171) Summary Files. Figures from censuses from 1850 to 2000 are from the bureau’s “Demographic Trends in the 20th Century” and “Bicentennial Edition: Historical Statistics of the United States, Colonial Times to 1970.”
Households per adults (or headship rates) and the share of adults living alone are derived from the Current Population Survey Annual Social and Economic Supplement (ASEC), which is conducted in March of every year. Conducted jointly by the Census Bureau and the Bureau of Labor Statistics, the CPS is a monthly survey of approximately 60,000 households and is the source of the nation’s official statistics on unemployment. The ASEC survey in March features a larger sample size. Data on income and poverty from the ASEC survey serves as the basis for the well-known Census Bureau report on income and poverty in the United States.
The CPS microdata files analyzed were provided by the IPUMS at the University of Minnesota.
The onset of the COVID-19 pandemic impacted the data collection for the 2020 ASEC. The response rate for the March 2020 survey was about 10 percentage points lower than preceding months. Using administrative data, Census Bureau researchers have shown that nonresponding households were less similar to respondents than in earlier years. They also generated entropy balance weights to account for this nonrandom nonresponse. The 2020 ASEC figures presented used these supplementary weights.
Statistics for households classified by racial, ethnic or age groups are based on the characteristics of the householder. For example, households per 100 White adults is the ratio of the number of households headed by White adults to the total number of White adults (times 100).
The subpar growth in households over the last decade matters because household formation has implications for the broader economy. It can impact the demand for housing and stimulate both single family and multifamily construction. Associated with that is spending for durable goods such as furniture and appliances. The slowdown in economic growth over the 2010s is partly a reflection of weak household formation and low levels of home building.
Several long-term demographic trends are affecting U.S. household growth. A fundamental driver of household growth is population growth. The population residing in households (that is, those who do not live in group quarters such as dorms, prisons or nursing homes) grew by only 7.5% in the last decade, the slowest population growth since the 1930s.
Beyond population growth, another demographic trend also slows growth in the number of households: Multigenerational family living has been increasing. In 2016, 20% of the U.S. population lived in multigenerational family households, up from 12% in 1980. Almost all of these involve two or more adult generations living under one roof rather than in separate households.
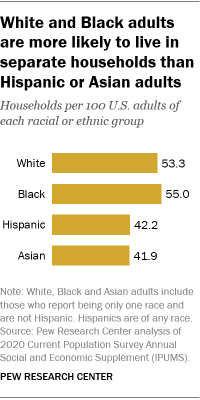
More broadly, the U.S. racial or ethnic groups that are growing most rapidly are less likely than other groups to live in their own households, in part because adults in these groups are younger. Asian and Hispanic adults – the fastest growing racial or ethnic groups in the U.S. – are less likely than White and Black adults to live in separate households. In 2020, there were 42.2 households for every 100 Hispanic adults and 41.9 households for every 100 Asian adults. White (53.3 households per 100 adults) and Black adults (55.0 households per 100 adults) were more likely to live in separate households.
Another factor affecting household growth is the declining tendency of adults to live alone. Throughout much of the 20th century, American adults had been increasingly living alone. That trend has slowed markedly since the early 2000s. Adults ages 65 and older are the most likely to live alone. The share of older adults living alone peaked in the mid-1990s (32%) and has since retreated (27% as of 2020).
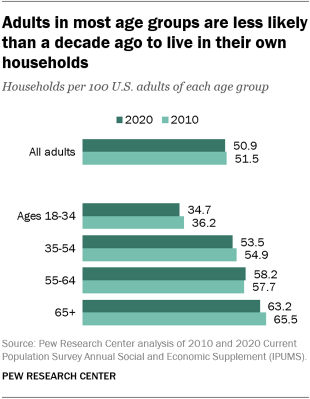
The rate at which adults are living in their own household declined over the past decade among younger and older adults alike, with the exception of those ages 55 to 64. Still, older adults remain more likely than those who are younger to live in their own households, in part because incomes rise as people get older and they have more economic resources to set up their own household. In 2020, there were 34.7 households per 100 adults ages 18 to 34, compared with 63.2 households per 100 adults ages 65 and older. Overall, the household formation rate declined slightly from 51.5 households per 100 adults in 2010 to 50.9 households per 100 adults in 2020.
Some geographic trends may also be contributing to diminished household growth. The U.S. population is increasingly likely to live in metropolitan areas. Today, 14% of the adult population is in rural areas, down from 16% in 2010. Adults in rural areas are more likely to live in their own households (54.9 households per 100 adults) than adults in metropolitan areas (50.2 households per 100 adults).
Rising housing costs are also likely undermining household growth. Nationally, rents have been rising much faster than inflation in general. From 2010 to 2020, the consumer price index for rent of primary residence rose 37%, compared with an increase of 13% for the CPI for all items except for shelter. Home prices have roughly doubled since 2000, according to the Case-Schiller national home price index.
Census experts had previously noted the slow household growth over the decade and surmised that household growth might lag population growth over the decade, resulting in the first ever increase in household size. That did not come to pass, as the average household size decreased from 2.58 (2010) to 2.55 (2020).
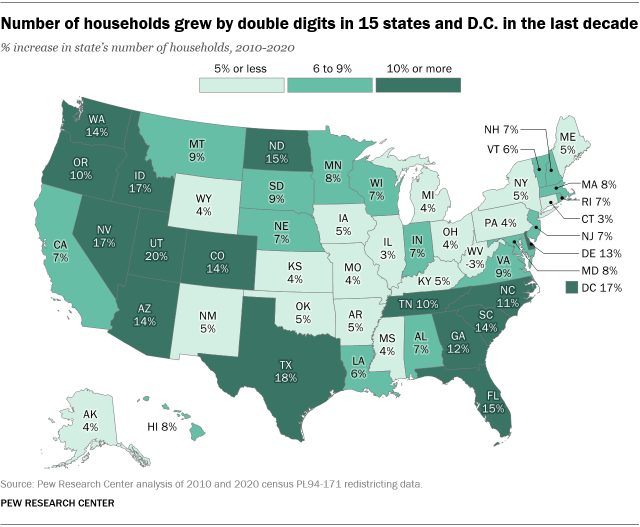
Slow household growth has played out differently across the states and the District of Columbia. Fifteen states and the District of Columbia had double-digit growth since 2010, with Utah leading the nation (20%). Conversely, 18 states had household growth of 5% or less, with West Virginia as the only state to experience a decline in the number of households (-3%). The growth (or decline) in households across states largely reflects population changes during the decade.
Note: For detailed household and population data by state for 2020 and 2010, read this Excel sheet.


