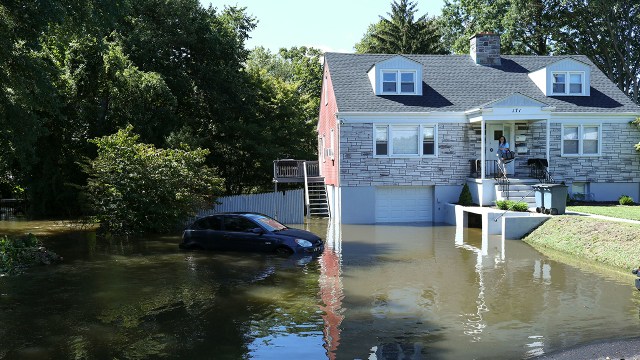
Powerful storms, wildfires, heat waves and other extreme climate-related events are projected to become more common and affect more people. According to a recent Washington Post analysis, nearly a third of Americans live in a county that was struck by a weather disaster this past summer, and around two-thirds live in places that experienced a multiday heat wave. In an April Pew Research Center survey, half of Americans said their area had experienced extreme weather over the past year.
Human-caused climate change will make extreme weather events more frequent and more damaging in the coming decades, according to the latest report from the United Nations Intergovernmental Panel on Climate Change. While the nations of the world struggle to agree on how to address the root causes of climate change, there are various ways people can prepare to deal with the immediate effects on a household level.
This analysis examines the prevalence of four specific tools to endure extreme weather in the United States: flood insurance, air conditioning, portable generators and home insulation. (As we’ll see, some of these tools may have their own climate impacts.)
2021 has been a year of extreme weather in the United States (not to mention elsewhere), often in places not accustomed to it – bone-chilling cold in Texas, massive flooding in New York City and heat waves in the Pacific Northwest. Given that climate scientists expect such events to become more common in the future, we decided to get a sense of how prepared Americans are for what may lie in store.
The Census Bureau’s American Housing Survey was our main source for data on the prevalence of air conditioning and portable generators. The National Flood Insurance Program (part of the Federal Emergency Management Agency) has a wealth of data about its operations; we also used survey data from the Insurance Information Institute’s “Triple-I Consumer Poll.” Finally, the U.S. Energy Department’s Residential Energy Consumption Survey yielded data on how well people thought their homes were insulated and – perhaps more tellingly – how drafty those homes were in the winter.
Flood insurance
Standard homeowner or renter insurance seldom, if ever, protects against flood damage. While some private companies sell their own flood insurance, the primary provider of such coverage in the United States is the National Flood Insurance Program (NFIP), managed by the Federal Emergency Management Agency.
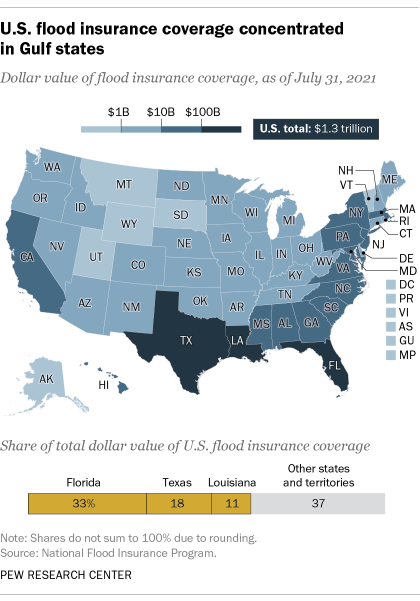
Nearly 5 million NFIP policies were in force as of July 2021, the most recent month available. That figure hasn’t varied much for the past few years, though it’s down from a peak of 5.7 million policies at the end of 2009. Flood insurance is available in over 22,000 communities throughout the country, but it’s particularly important in states that border the Gulf of Mexico: 60% of all policies in force, accounting for a somewhat higher share of covered property value, are in Florida, Texas and Louisiana.
More than a quarter of U.S. homeowners (27%) said in a 2020 survey by the Insurance Information Institute, or Triple-I, that they had flood insurance – more than twice the share who said they had it in 2018 (13%). However, the Triple-I itself has expressed some doubt about whether flood coverage is that high. Noting that the NFIP data implies a lower coverage rate, the institute said, “It is possible that [people] with homeowners insurance believe they have flood coverage when they actually do not … homeowners may not fundamentally understand what flood coverage is and how it works. Or they may think flood coverage encompasses water damage from a burst pipe instead of a weather-related event like a hurricane or from a river flooding.”
Next month, NFIP will change the way it sets its insurance rates to better reflect each individual property’s actual flood risk. The current system, which has been in place since the 1970s, relies mainly on a property’s elevation and location within a floodplain. Critics have long argued that the program’s flood maps aren’t updated frequently enough and understate true flood risks, and that the guaranteed availability of flood insurance can encourage flooded-out owners to rebuild structures rather than move them to safer ground.
Air conditioning
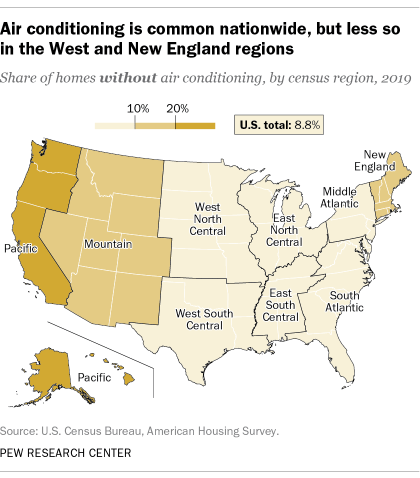
Air conditioning, either central or room-based, has become the default in American homes – a boon during oppressive summer heat waves. Nationwide, only 8.8% of housing units lacked some form of air conditioning in 2019, according to the Census Bureau’s American Housing Survey for that year. But that ubiquity obscures some important geographic and demographic variations.
In Northern California and the Pacific Northwest, for instance, residents long were accustomed to cool, rainy winters and mild, low-humidity summers. The consequence: 55.7% of housing units in Seattle have no air conditioning of any sort, nor do 52.7% in San Francisco and 21.4% in Portland, Oregon. But long stretches of days with temperatures of 100 degrees and higher reportedly have sent at least some Northwesterners fleeing to home improvement stores and HVAC contractors in search of relief.
Americans with higher incomes are moderately more likely to have access to air conditioning, according to the Census Bureau data, though the differences are smaller than you might expect: 92.2% of households with incomes of $100,000 or more have some form of air conditioning, compared with 88.9% of households with incomes of less than $30,000.
The type of AC, however, does vary more substantially by income. Among below-$30,000 households with air conditioning, 70.1% have central air and 29.9% have window units, which generally can only effectively cool a single room. Among households earning $100,000 or more, the split is 85.6% central, 14.2% window.
Either way, air conditioning uses prodigious amounts of electricity, and depending on how that electricity is generated, AC can exacerbate the very problem it’s trying to alleviate. AC units can also emit waste heat and greenhouse gases of their own into the atmosphere. As The Guardian put it a few years back, “The warmer it gets, the more we use air conditioning. The more we use air conditioning, the warmer it gets.”
Generators
Of course, air conditioners won’t work without electricity. Nor will refrigerators, washers, computers or any number of other critical appliances – not to mention lights. People who live in storm-prone areas, such as the Gulf Coast or North Carolina’s Outer Banks, often have portable generators in case the local electricity grid fails (as it did this year in New Orleans after Hurricane Ida).
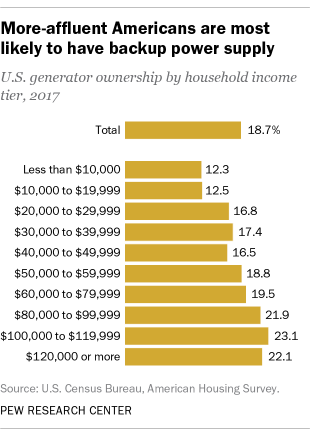
The American Housing Survey’s latest data on generator ownership is from 2017. That year, only about 19% of U.S. households reported owning the devices. (The question was only asked of people living in single-family homes and small apartment buildings.) The income difference on generator ownership was much more pronounced than with air conditioning: 22.4% of households earning $100,000 or more reported having a generator, versus 14.1% of households making less than $30,000.
The regional differences are noteworthy too. Nearly a quarter (24.2%) of New England housing units surveyed had a generator, versus just 14.2% in the Mountain states. Among metro areas, Richmond, Virginia, and Miami-Fort Lauderdale stood out, with 28.8% and 26.6%, respectively, of housing units having generators. California’s Bay Area was a notable laggard, with just 6.3% of units in San Francisco and 7.5% in San Jose having generators.
Most home generators, however, burn fossil fuels such as gasoline, diesel or propane to generate electricity, which means they’re also generating greenhouse gases that are major drivers of climate change. Clean energy groups advocate for different approaches: combining storage batteries with solar panels mounted on homes, businesses and other structures, for instance, or installing neighborhood-scale “microgrids” that can operate on their own if the wider transmission grid goes down.
Insulation
Climate change doesn’t just mean warmer temperatures. As extreme weather of all types, such as the wave of winter storms and bone-chilling cold that nearly paralyzed much of Texas last winter, becomes more common, millions can be left without heat, water and power for days on end.
That’s where insulation – a relatively low-tech solution that can increase a home’s energy efficiency so that it stays warmer in the winter and retains cool air-conditioned temperatures in the summer – can make a big difference. Many homes in Texas, it turned out, had inadequate or nonexistent insulation, which led to cracked pipes and frigid indoor temperatures.
The best data on home insulation comes from the 2015 Residential Energy Consumption Survey (RECS), a project of the federal Energy Information Administration. In addition to asking people how adequately they thought their home was insulated, the RECS researchers asked how often their home felt drafty in the winter (because previous surveys had found few people knew details about the amount or quality of their home’s insulation).
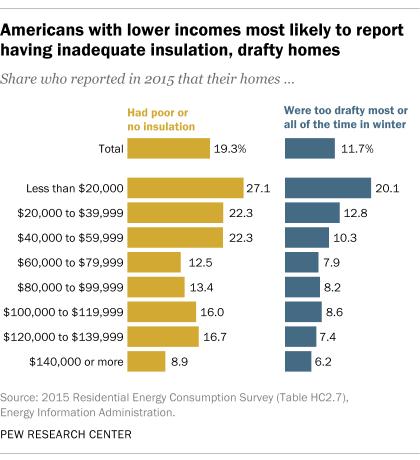
Overall, 19.3% of households said they had poor or no insulation, a slight improvement from the 21% who said that in the 2009 RECS. And 11.7% said their homes were drafty most or all of the time in winter, down from 15.4% in 2009.
A quarter (25.1%) of respondents in the Pacific region said they had poor or no insulation, though only 12.3% said their homes were drafty most or all of the time in the winter. Only 14.3% of householders in the Mountain North subregion (Colorado, Idaho, Montana, Utah and Wyoming) characterized their insulation as poor or nonexistent, and just 9.5% said their homes were drafty most or all of the time. In the Mountain South states of Arizona, New Mexico and Nevada, where 16.3% said their homes had poor or no insulation, just 7% said their homes were that drafty.
In general, the lower one’s household income, the worse one’s home was insulated and the draftier it was. More than a quarter (27.1%) of people whose household income was less than $20,000 said they had poor or no insulation, and a fifth (20.1%) said their homes were drafty most or all of the time in winter. For people with household incomes of $140,000 or more, those figures were 8.9% and 6.2%, respectively.
Pew Research Center editorial assistant Rebecca Leppert contributed to this analysis.


