Every two years, Pew Research Center updates its series of fact sheets on the U.S. news media industry, tracking key audience and economic indicators for a variety of sectors. Here are some key findings about the state of the industry in 2020.
The State of the News Media fact sheets use a range of different methodologies to study the health of the U.S. news industry, including custom analysis of news audience behavior, secondary analysis of industry data and direct reporting to solicit information unavailable elsewhere. All sources are cited in chart and graphic notes or within the text of the report. Read the methodology.
Pew Research Center is a subsidiary of The Pew Charitable Trusts, its primary funder. This is the latest report in Pew Research Center’s ongoing investigation of the state of news, information and journalism in the digital age, a research program funded by The Pew Charitable Trusts, with generous support from the John S. and James L. Knight Foundation.
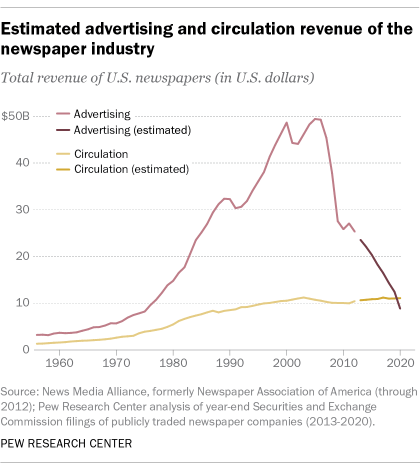
For the first time, newspapers made more money from circulation than from advertising, according to an analysis of Securities and Exchange Commission (SEC) filings of publicly traded newspaper companies. For more than 50 years, U.S. newspapers had more annual revenue from advertising than from circulation (e.g., selling subscriptions or single issues). But with ad revenue in a long-term decline and circulation revenue holding steady, the two streams finally crossed in 2020.
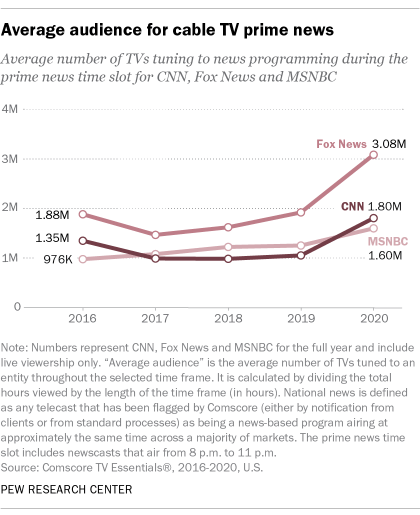
In a year dominated by major news events, cable news channels saw explosive audience growth in 2020. In prime time, Fox News’ average audience increased by 61%, CNN’s increased by 72% and MSNBC’s grew by 28%, according to Comscore TV Essentials® data. Other TV news sectors also saw audience growth, but to smaller degrees. The average audience for network nightly news, for example, increased by between 7% and 16%, and the average audience for local TV evening news increased 4%. Spanish-language news on Telemundo and Univision also generally saw an audience increase in 2020.
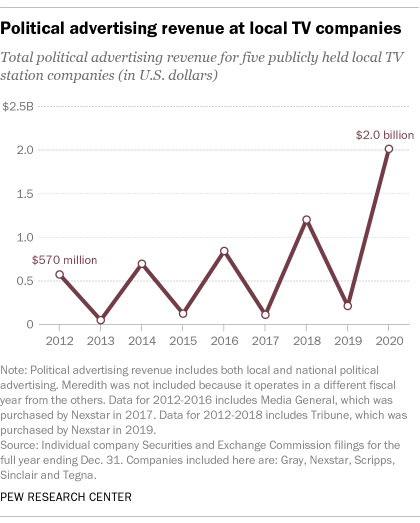
Political ad revenue at local TV stations was dramatically higher in 2020. Though it always rises in election years, it totaled $2 billion in 2020 – far above any prior year, according to an analysis of SEC filings of five major publicly held local TV station companies.
Individual giving is making up a larger piece of the revenue pie for public broadcasters. In 2014, for example, just 3% of nonpublic funding for the PBS NewsHour came from individuals. By 2020, the share had climbed to 24%. Over the same period, contributions from corporations fell from 41% to 18%, according to information provided by PBS NewsHour. At public radio stations, meanwhile, individual contributions rose from $261 million to $430 million between 2008 and 2019, while underwriting revenue has risen far less, according to an analysis of public filings provided by 123 of the largest news-oriented licensees.
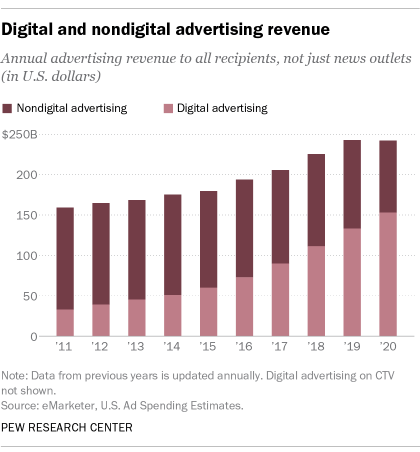
Total advertising revenue – beyond just news – is now mostly digital, according to eMarketer estimates. As of 2019, more ad revenue came from digital advertising than nondigital advertising, such as print and broadcast. A major driver of this trend has been mobile advertising, which rose roughly sixtyfold between 2011 and 2020, from $1.7 billion to $102.6 billion.
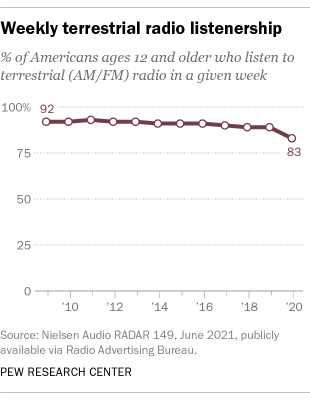
While terrestrial radio listenership declined in 2020, the audience for online audio has grown. NPR’s weekly podcast audience, for instance, nearly doubled in the past two years, from about 7 million in 2018 to about 14 million in 2020, according to data provided by the broadcaster. (NPR now makes more money from underwriting on its podcasts than its radio shows.) Around three-in-ten Americans ages 12 and older (28%) now say they listened to podcasts in the past week, according to “The Infinite Dial” report by Edison Research and Triton Digital.
But after years of almost perfectly steady listenership, terrestrial radio (i.e., AM/FM) saw its overall audience – not just for news – decline in 2020. The decrease coincided with a sharp decrease in automobile use during the COVID-19 pandemic. In 2020, 83% of Americans ages 12 and older listened to terrestrial radio, down from 89% in 2019 and 92% in 2009, according to Nielsen Media Research data published by the Radio Advertising Bureau.
Note: To learn more, explore all eight fact sheets on the state of the news media and the methodologies used to compile them.


