About one-in-ten people eligible to vote in this year’s U.S. presidential election are immigrants. And most (61%) of these 23 million naturalized citizens live in just five states.
California has more immigrant eligible voters (5.5 million) than any other state, more than New York (2.5 million) and Florida (2.5 million) combined. Texas and New Jersey round out the top five, with 1.8 million and 1.2 million immigrant eligible voters, respectively.
Here is a closer look at immigrant eligible voters in these five states.
This post is part of a continuing exploration of immigrants in the U.S. and their eligible voter population. For this project, we analyzed the detailed demographics and geographic distribution of immigrants who are eligible to vote in the 2020 presidential election. The term “eligible voters” refers to persons ages 18 and older who are U.S. citizens. The analysis is based on data from the 2018 U.S. Census Bureau’s American Community Survey provided through Integrated Public Use Microdata Series (IPUMS) from the University of Minnesota.
 1Asians make up 43% of immigrant eligible voters in California, the highest of any racial or ethnic group. Nationally, Latinos make up a higher share of immigrant eligible voters than Asians (34% vs. 31%), but the reverse is true in the Golden State, where many Latino immigrants are ineligible to vote because they do not hold U.S. citizenship.
California’s immigrant eligible voters come from many countries. But three origin countries account for 46% of the total: Mexico (1.5 million immigrant eligible voters), the Philippines (604,000 voters) and Vietnam (430,000 voters).
The vast majority of California’s immigrant eligible voters (75%) have lived in the United States for more than 20 years. The share is highest (82%) among California’s Latino immigrant voters. Smaller majorities of Asian (71%), white (71%) and black (59%) immigrant eligible voters in California have lived in the country for at least two decades. English proficiency varies widely among the state’s immigrant eligible voters. For example, 86% of black immigrant eligible voters in California are English proficient, a substantially higher share than among all the state’s immigrant eligible voters (55%).
 2New York stands out for the racial and ethnic diversity of its immigrant eligible voters. Asians (26%), Latinos (25%) and whites (25%) make up similar shares of the state’s immigrant eligible voters, while black immigrants (21%) are a slightly lower share.
When it comes to speaking English, black immigrant eligible voters in New York are substantially more likely to be English proficient (89%) than white (66%), Asian (52%) and Latino (47%) immigrant voters.
In New York, no single birth country accounts for a large share of the state’s immigrant eligible voters; about a quarter of foreign-born voters come from the state’s three largest birth countries. Immigrants from the Dominican Republic are the largest single group, with 264,000 eligible voters, followed by China (207,000) and Jamaica (143,000).
3Latinos make up 54% of Florida’s immigrant eligible voters, far higher than the shares of white, black and Asian immigrant voters in the state (17%, 16% and 10% respectively).
Florida’s immigrant voters have varying levels of English proficiency. For example, around half (51%) of Latino immigrant eligible voters are proficient in English, a far lower share than among white (82%) or black (81%) immigrant voters.

With 606,000 voters, Cuban immigrants are the largest group in Florida’s foreign-born electorate. Colombian immigrants, at 190,000, and Haitian immigrants, at 187,000, are the second- and third-largest groups.
4Texas rivals Florida in its share of Hispanic immigrant voters. Roughly half (52%) of all immigrant eligible voters in Texas are Hispanic, a share that trails only Florida (54%) among the top states. Asian immigrants are the second-largest group in Texas at 29%.
Around seven-in-ten immigrant voters in Texas (68%) have lived in the U.S. for more than two decades, similar to the share among all U.S. immigrant voters (68%). However, the share of long-term residents is notably lower among black immigrant voters in Texas (40%).
A high share of black and white immigrant voters in Texas are English proficient (88% and 85%, respectively). Lower shares of Asian (64%) and Hispanic (47%) immigrant voters are proficient. This is similar to the pattern nationally.
By country of birth, Mexican immigrants alone account for 40% of all immigrant voters in Texas, or 736,000 people. The second-largest group, with 130,000 voters, are immigrants from Vietnam, while Indian immigrants, with 115,000 voters, make up the third-largest group in the state.
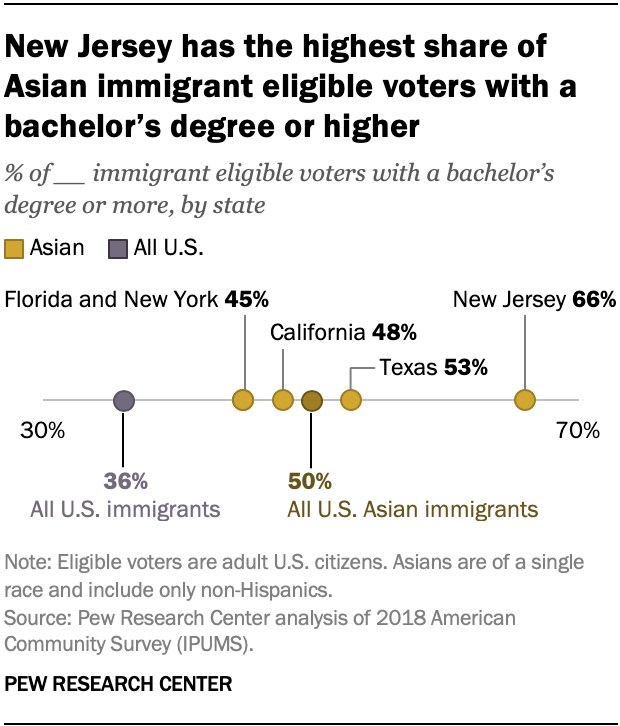
 5New Jersey has a high share of Asian immigrant voters with a college degree. About two-thirds of Asian immigrant voters in New Jersey (66%) have a bachelor’s degree or higher. That’s substantially higher than the share among other immigrant voter groups in the state and the share among immigrant voters in the U.S. overall (36%), including those who are Asian.
Among New Jersey’s 1.2 million immigrant eligible voters, 32% are Latino, 30% are Asian, 25% are white and 11% are black.
Meanwhile, the top birth countries for immigrant eligible voters in New Jersey are India (122,000 voters), the Dominican Republic (103,000) and the Philippines (63,000).
See the table below (or open it as a PDF) for detailed characteristics of immigrant eligible voters in California, New York, Florida, Texas, New Jersey and nationally.


