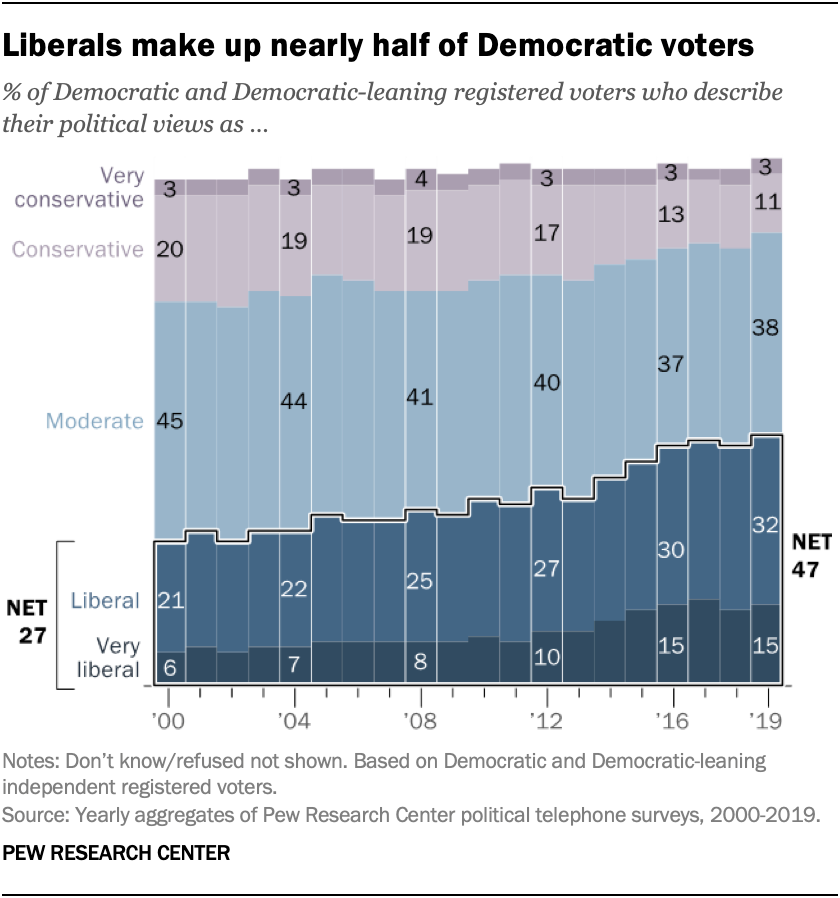
 About half of Democratic and Democratic-leaning registered voters (47%) describe their own political views as liberal, including 15% who describe their views as very liberal, according to an average of Pew Research Center political surveys conducted in 2019.
The share of Democratic voters who describe their political views as liberal has changed little over the past few years after increasing steadily between 2000 and 2016.
Liberals outnumber moderates (38%) and conservatives (14%) as a share of Democratic voters. Yet combined, conservatives and moderates continue to make up about half of Democratic voters (51%).
This analysis of changes in the self-identification of ideology among Democratic registered voters over time is based on a compilation of 239 phone surveys conducted by Pew Research Center from January 2000 through September 2019. These surveys were combined into a single, large file that allowed us to analyze data across a range of demographic characteristics, with comparisons made across different time periods. When combined, the 239 surveys represent over 150,000 interviews with Democratic or Democratic-leaning registered voters, or more than 8,000 interviews with this group each year. Yearly averages are calculated by combining all surveys for the calendar year, with appropriate weights applied.
While the ideological composition of the Democratic coalition is not much different than in 2016 – when liberals constituted 45% of Democratic voters – liberals make up a larger share of Democratic voters than they did in earlier presidential election years.
In 2012, when Barack Obama was reelected, a somewhat larger share of Democratic and Democratic-leaning registered voters called themselves moderates (40%) than liberals (37%), while 19% described their views as conservative. And in 2004, when George W. Bush was reelected after defeating John Kerry, just 30% of Democratic voters called themselves liberal, while more than twice as many (66%) described themselves as moderate or conservative.
The subset of Democratic voters who describe their views as very liberal has similarly increased since 2000, though they remain a relatively small group within the party. In 2000, just 6% of Democratic and Democratic-leaning registered voters said their political views were very liberal. By 2019, 15% of Democrats described their views this way.
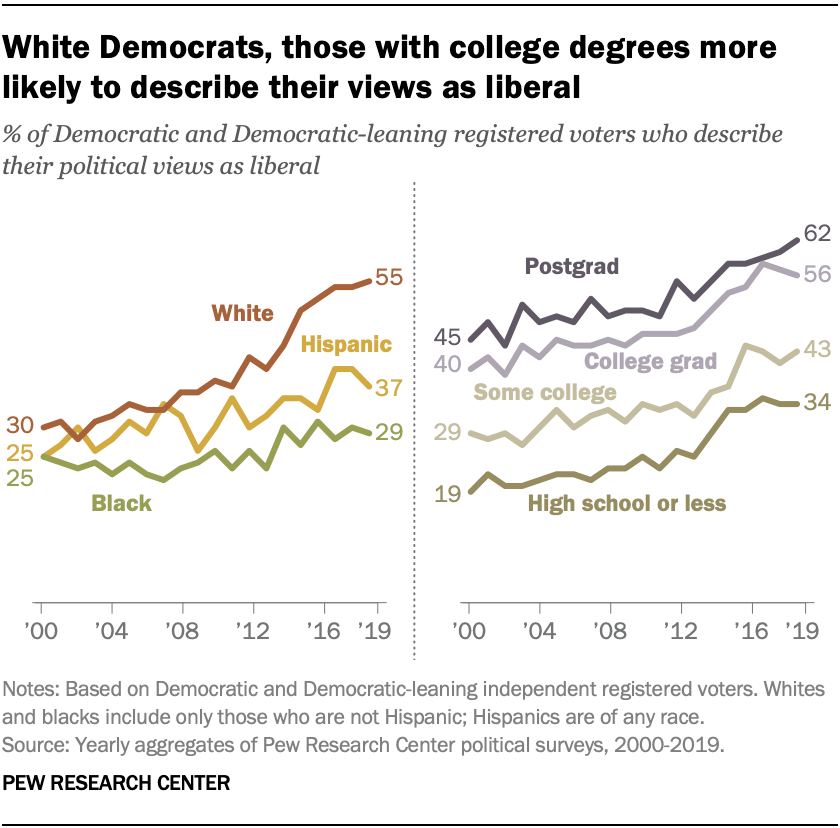
 White Democrats remain more likely than black or Hispanic Democrats to describe themselves as liberal. In 2019, a majority (55%) of white Democratic and Democratic-leaning registered voters identified themselves as liberal, an increase of 27 percentage points since 2000. Among white Democrats, 19% called themselves very liberal in 2019, compared with 6% in 2000.
By contrast, more black Democratic voters continue to characterize their views as moderate rather than liberal. In 2019, 43% of black Democrats called themselves moderate, 29% called themselves liberal and 25% called themselves conservative.
Since 2000, the share of black Democrats who describe their political views as liberal has changed little, while liberal identification among white Democrats has nearly doubled.
Among Hispanic Democratic voters, 38% described their political views as moderate in 2019, while 37% called themselves liberal and 22% conservative.
A majority of Democratic voters with postgraduate experience (62%) described their political views as liberal last year, as did 56% of college graduates with no postgraduate experience. The share calling themselves very liberal was 19% among those with a postgraduate education and 18% among those with a college degree.
Fewer Democratic voters among those with some college experience but no degree (43%) and those with no college experience (34%) characterized their political views as liberal or very liberal in 2019. Just 13% of Democrats with some college education and 11% of Democrats with no college education described their own views as very liberal.
Americans’ descriptions of their political views are distinct from, but strongly related to, their attitudes on specific issues. Most Americans continue to express at least some mix of liberal and conservative attitudes, but the share with either uniformly liberal or uniformly conservative attitudes has grown in recent years.
Note: This is an update of a post previously published Sept. 7, 2017.


