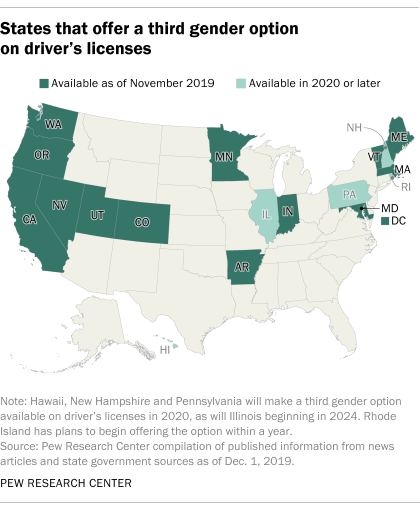
 In 2019, at least seven states have started offering a third gender option on driver’s licenses for people who don’t identify as male or female, and at least four more plan to do so in 2020. A number of states have also added a third gender option on birth certificates. These changes follow decisions by some popular social media platforms to offer their own nonbinary gender options.
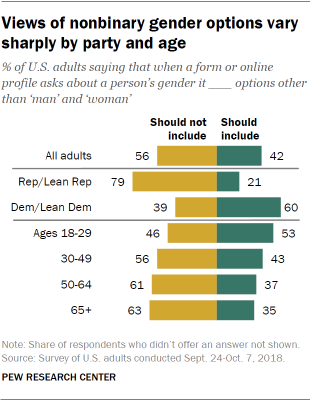
Amid these changes, about four-in-ten Americans (42%) say that when a form or online profile asks about a person’s gender, it should include options other than “man” and “woman” for people who don’t identify as either, according to a Pew Research Center survey conducted in fall 2018. Still, a majority (56%) says that forms should not include other gender options.
See also: About one-in-five U.S. adults know someone who goes by a gender-neutral pronoun
 Partisanship plays a large role in views on whether forms should offer nonbinary gender options. Six-in-ten Democrats and Democratic-leaning independents say forms should include a third gender option; just 21% of Republicans and Republican leaners say the same.
Younger adults are more likely than their older counterparts to support including third gender options on forms or online profiles. Roughly half of Americans ages 18 to 29 (53%) say that forms should include other gender options, compared with 43% of those ages 30 to 49, 37% of those 50 to 64 and 35% of those 65 and older.
Age differences are evident among both Democrats and Republicans, but the partisan divide is far wider than those by age. Majorities of Democrats across age groups say forms should include additional gender options, while even among the youngest Republicans, only about a third (32%) support this.
Among Democrats, views vary considerably by education. Seven-in-ten Democrats with a bachelor’s degree or higher say that forms should include other gender options, compared with 62% of those with some college experience and 49% of those with a high school diploma or less education. By contrast, Republicans’ views are uniform across educational groups.
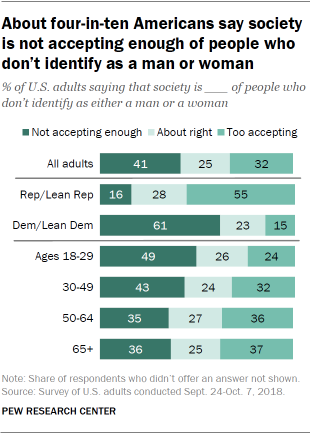
 When it comes to views of how accepting society in general is of people who don’t identify as either a man or a woman, a plurality of Americans (41%) say society is not accepting enough, while roughly a third (32%) say it is too accepting and a quarter say it is about right. Views diverge sharply by partisanship and age here too, with Democrats and younger adults more likely than Republicans and those who are older to say society is not accepting enough of people who don’t identify as a man or a woman.
Among Republicans younger than 30, somewhat similar shares say society is too accepting (41%) and say it is about right (35%), while about a quarter (23%) say society is not accepting enough. By comparison, majorities of Republicans ages 30 to 49 (56%), 50 to 64 (58%) and 65 and older (60%) say society is too accepting of people who don’t identify as a man or a woman. Democrats’ views vary little by age.
Again, education gaps are evident among Democrats. About seven-in-ten Democrats with at least a bachelor’s degree (71%) – and a narrower majority (61%) of those with some college – say society is not accepting enough of people who don’t identify as a man or a woman; about half of those with a high school diploma or less education (52%) say the same. Just 8% of Democrats with a bachelor’s degree or higher say society is too accepting, compared with 15% of those with some college and 21% of those with less education.
Note: Findings on these questions were previously released as part of a report that explored generational differences in views of political and social issues. That report combined data from two surveys: a survey of U.S. adults ages 18 and older and a survey of teens ages 13 to 17. The findings in this post are based only on the survey of adults ages 18 and older. See full topline results and methodology.


