The political battle over Brexit in the UK has dragged on for more than three years without resolution, helping to fracture the nation’s politics. A question that has divided British politics – whether to leave the European Union or remain part of it – aligns with attitudes toward the EU, immigration and the country’s culture, but traditional cleavages along party lines and the left-right ideological spectrum still exist on other topics, according to a new Pew Research Center survey.
The survey was conducted among 1,031 UK adults from June 4 to July 20, 2019, before Boris Johnson became prime minister on July 24. Here are its key findings:
1The 2016 EU referendum vote cut across party and ideological lines. Similar to what exit polls after the vote showed, our survey found that people who voted “leave” were on average more likely than those who voted “remain” to be male, older, and have less education and lower incomes, and they were less likely to be from urban areas.
Politically, seven-in-ten Liberal Democrats and about half of Labour identifiers said they voted “remain,” while six-in-ten Conservative supporters reported voting “leave,” our survey found. While these are striking numbers, partisan support does not completely align with vote choice in the referendum, with about two-in-ten Labour and 29% of Conservative supporters saying they voted differently than the majority of their respective parties.
People on the political left reported voting overwhelmingly for “remain,” while people in the political center and on the political right lined up less starkly when it comes to vote choice in the referendum. Those who place themselves in the center were about equally likely to report voting “leave” as “remain,” while a plurality of those on the political right reported voting “leave.”
2Remainers and leavers are starkly divided in their views of the EU. 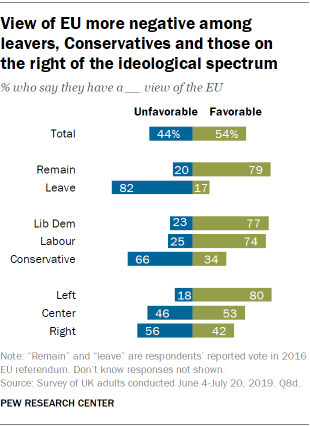 Strong majorities of those who reported a “remain” vote had a favorable view of the EU, while those who reported voting “leave” had an unfavorable view. A favorable view of the EU was largely consistent in both sentiment and magnitude when comparing “remain” voters, people who identify with the Liberal Democrats or Labour, and those on the political left. While an unfavorable view of the EU was generally consistent, the magnitude of this sentiment varied to a greater degree across “leave” voters, Conservative supporters and those on the political right.
Unlike on the political left, where a large majority expressed a favorable view of the EU, people on the political right were almost equally likely to have a favorable view as they were to have an unfavorable view of the EU. This split was also evident among those in the political center, of whom about half expressed a positive view; roughly the same share viewed the institution negatively.
3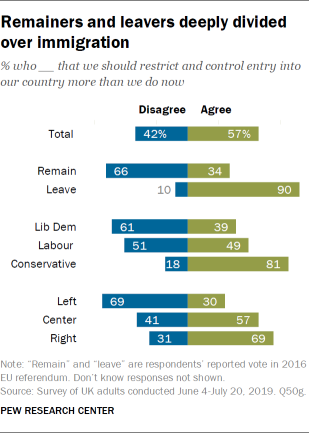 Concerns about immigration deeply divide remainers and leavers. A majority (57%) of the British public said they favor more restrictions on entry into the UK. People who reported voting “leave” were much more likely than those who reported voting “remain” to favor more restrictive immigration.
Big majorities of Conservative identifiers and people on the political right similarly supported more restrictions on immigration, but to a lesser extent than “leave” voters. While only three-in-ten people on the political left supported more restrictive immigration, Labour supporters were nearly evenly split: 49% were in favor and 51% were not.
4Leavers and remainers differ over the future of the country’s culture, less so on other issues. About six-in-ten Britons (62%) said they are optimistic about the outlook for the country’s culture. Labour and Conservative supporters were about equally likely to say that they are optimistic about the country’s culture, as were those from the political left, center or right. Leavers were more likely to say that they are pessimistic about the country’s culture than those who voted “remain” (a difference of 14 percentage points). This divide was more apparent between leavers and remainers than among those on the left-right spectrum or with partisan identities.
While the leave/remain divide was stark on levels of optimism about the country’s culture, this does not carry over when looking at attitudes toward other domestic concerns. Remainers and leavers were similarly pessimistic about the political system, with only 23% of remainers and 24% of leavers saying they are optimistic. Indeed, greater divides were reflected among partisans and those on the political right and left than among leavers and remainers in views of the political system and other topics. This included relations with Europe, reducing the gap between the rich and poor, the availability of well-paying jobs and the country’s education system. On each of these issues, the difference between leavers and remainers was smaller than the divides between partisans and those on the political left and right.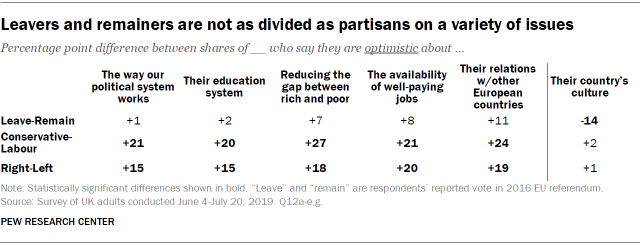
5Views of the economy are closely associated with party affiliation and where people stand on the political spectrum, less so the EU referendum vote. 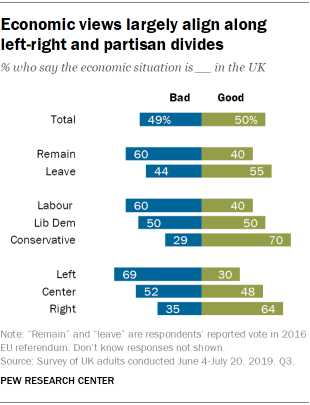 The British public was roughly divided on their views of the economy, with 49% saying that the economic situation is bad in the UK and 50% saying that it is good. Positive views were concentrated among Conservative supporters and those on the political right, with a slimmer majority among “leave” voters. Negative views predominated among those who voted “remain” (60%), supporters of Labour (60%) and people on the political left (69%).
The direction of sentiment about the economy aligns with EU referendum vote choice, party identification and placement on the political spectrum, but the degree of difference within each of these groups vary. Britons on the political right were much more likely than those on the left to have a positive view of the economy (a difference of 34 percentage points), a pattern similar when comparing Conservative and Labour supporters (a 30-point difference).
6Over the period of the Brexit battle, Britons have come to regard their democracy more negatively. In our spring 2019 survey, 69% said they were not satisfied with the way democracy was working in the country. That compares with 55% in 2018 and 47% in 2017.
Note: See full topline and methodology.


