Latinos make up an increasing share of the U.S. electorate. A record 29 million Latinos were eligible to vote in this year’s midterm elections, accounting for 12.8% of all eligible voters, a new high. While it’s too soon to know how many voted and their turnout rate, Latinos made up an estimated 11% of all voters nationwide on Election Day, nearly matching their share of the U.S. eligible voter population (U.S. citizens ages 18 and older). Here are key takeaways about Latino voters and the 2018 elections.
1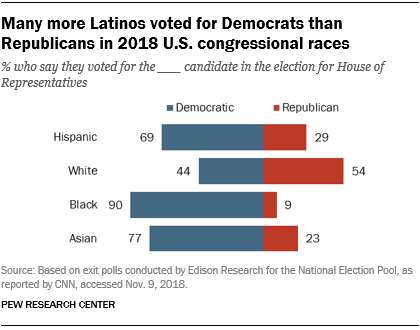 In U.S. congressional races nationwide, an estimated 69% of Latinos voted for the Democratic candidate and 29% backed the Republican candidate, a more than two-to-one advantage for Democrats, according to National Election Pool exit poll data. These results largely reflect the party affiliation of Latinos. In a Pew Research Center pre-election survey, 62% of Latinos said they identify with or lean toward the Democratic Party compared with 27% who affiliated with the Republican Party. Among other racial and ethnic groups, a lower share of whites (44%) voted for Democrats in congressional races compared with blacks (90%) and Asians (77%). (Exit polls offer the first look at who voted in an election, a portrait that will be refined over time as more data, such as state voter files, become available.)
2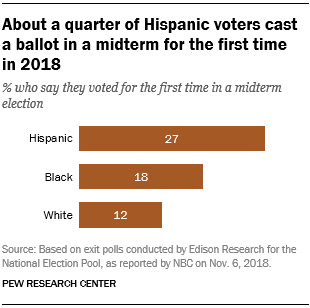 About a quarter of Hispanics who cast a ballot in 2018 (27%) said they were voting in a midterm for the first time, compared with 18% of black voters and 12% of white voters, according to the exit polls. Meanwhile, many new voters this year were young. A majority of voters younger than 30 said they were voting in a midterm for the first time. (Note: This item has been corrected. See details at end of post.)
3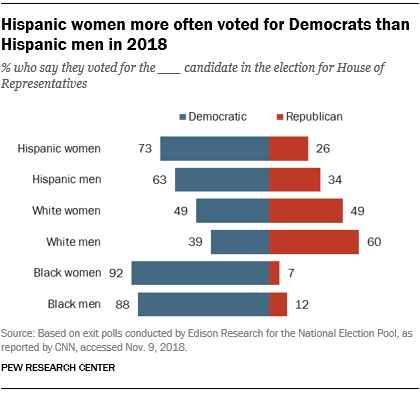 Hispanics had a gender gap in voting preference, with 73% of Hispanic women and 63% of Hispanic men backing the Democratic congressional candidates – a reflection of the election’s broad gender differences. In a pre-election Pew Research Center survey of Hispanics, differences by gender extended to views of the country. For example, Hispanic women were significantly more dissatisfied with the way things are going in the country today than Hispanic men.
A gender gap also existed among white voters, with 49% of white women backing the Democratic congressional candidate compared with 39% of white men. By contrast, few gender differences existed among black voters, with about nine-in-ten black voters of both genders backing Democratic candidates.
4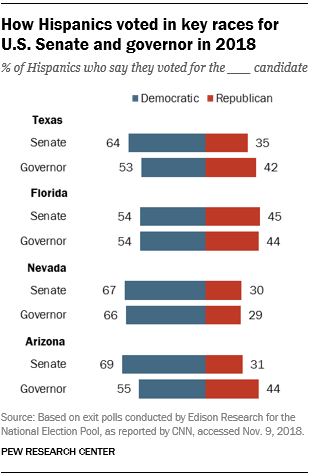 Latinos made up a notable share of eligible voters in several states with competitive races for U.S. Senate and governor, including Texas (30%), Arizona (23%), Florida (20%) and Nevada (19%). In these states, Democrats won the Latino vote, sometimes by a wide margin. In the Texas Senate race, 64% of Latinos voted for Democrat Beto O’Rourke while 35% voted for Republican incumbent Ted Cruz. In the state’s race for governor, about half of Hispanics (53%) voted for Democrat Lupe Valdez and 42% backed the Republican, Greg Abbott.
In Florida, Republican candidates often win a larger share of the Hispanic vote than elsewhere, in part due to a large population of Cubans that has tended to vote more Republican than other Hispanic groups. In the Senate race, 54% of Hispanics voted for Democrat Bill Nelson and 45% backed Republican Rick Scott. Latinos voted similarly in the race for governor, with 54% of Hispanics voting for Democrat Andrew Gillum and 44% voting for Republican Ron DeSantis.
Meanwhile, Latinos voted for Democratic candidates by wide margins in Nevada. About 67% of Latinos voted for Democrat Jacky Rosen in the Senate race, compared with 30% who voted for Republican Dean Heller. In the race for governor, Latinos voted in a similar manner.
5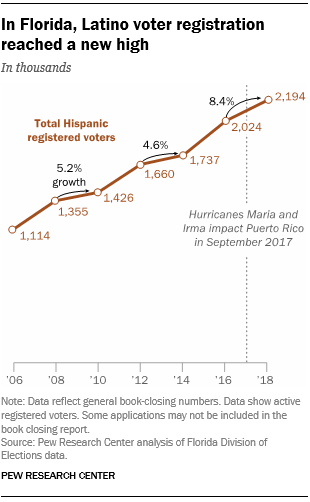 In Florida, the number of Hispanic registered voters reached 2.2 million this year, an 8.4% increase over 2016. This is nearly double the increase from the previous midterm election in 2014, when Hispanic voter registration increased 4.6% over 2012.
Counties with some of the largest Puerto Rican populations had some of the fastest growth in registered voters, including Polk, Pasco, Osceola, Lake, Marion and Volusia – all counties where Hispanic voter registration grew by 15% or more over 2016. (Note: This item has been corrected. See details at end of post.)
6Nine U.S. House districts in which Hispanics make up at least 10% of eligible voters changed parties. These include Florida’s 26th and 27th districts, California’s 25th District, Arizona’s 2nd District, Texas’ 7th and 32nd districts, Colorado’s 6th District, New York’s 11th District and New Jersey’s 2nd District. In all of these congressional districts, the Democratic candidate won a seat previously held by a Republican.
The number of representatives of Cuban origin representing South Florida districts fell from three to one. (South Florida holds more than half of the nation’s Cuban-origin population.) In Florida’s 26th District, Democrat Debbie Mucarsel-Powell, an immigrant from Ecuador, defeated incumbent Republican Carlos Curbelo, who is of Cuban origin. In addition, a Cuban no longer represents Florida’s 27th District, where longtime Rep. Ileana Ros-Lehtinen did not seek re-election. Democrat Donna Shalala defeated Republican Maria Elvira Salazar, who is of Cuban origin. Meanwhile, Republican Mario Diaz-Balart, who is of Cuban origin, won re-election in Florida’s 25th District.
Correction (Nov. 15): In a previous version of this post, item No. 2 and its corresponding chart misstated an exit poll finding. The survey question had asked whether respondents were voting in their first midterm election in 2018, not whether they were voting for the first time ever. In addition, item No. 5 has been updated to clarify that it was not referring only to newly registered voters.
Related posts:
How religious groups voted in the midterm elections
The 2018 midterm vote: Divisions by race, gender, education


