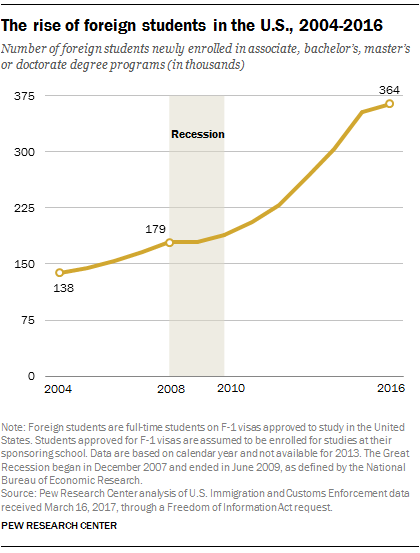
 Nearly 364,000 foreign students with F-1 visas were newly enrolled at a U.S. college or university in 2016, double the number at the outset of the Great Recession, according to a Pew Research Center analysis of U.S. Immigration and Customs Enforcement data obtained through a public records request.
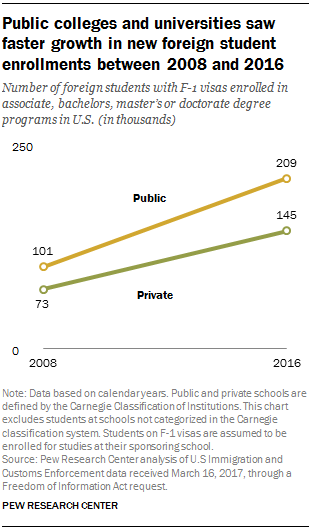
From 2008 to 2016, the number of new foreign students at U.S. colleges and universities increased 104% – far outpacing overall college enrollment growth, which was 3.4% during the same period, according to U.S. Census Bureau data. The increase was most pronounced at public colleges and universities, which faced budget cuts during the Great Recession and began to rely more heavily on tuition from foreign students.
In the years immediately preceding the Great Recession, growth in the number of new foreign students was more modest, increasing by 20% from 2004 to 2007, but still outpaced overall U.S. enrollment, which rose 7.2% over the same period.
Below are some key facts about foreign students studying in the United States. You can also explore the demographic characteristics of international students who pursued associate, bachelor’s, master’s and doctorate degrees from 2004 to 2016 with our new foreign student fact sheet.
Foreign students who would like to study in the U.S. are required to obtain a visa. The most common type of foreign student visa issued by the U.S. government is the F-1 visa, which are typically given to those pursuing a college or graduate degree. In 2016, 65% of 556,054 foreign students holding F-1 visas and studying in the U.S. had enrolled in a U.S. college or university. The remaining 35% of foreign students had enrolled in other educational institutions such as language training schools and high schools.
Data used in this analysis include only students with F-1 visas newly enrolled at U.S. colleges and universities who appeared in the federal government’s automated foreign student monitoring system, the Student and Exchange Visitor Information System. Data before 2004 are not used because in prior years not all foreign students were entered into the automated monitoring system.
The Sept. 11, 2001, terrorist attacks played a key role in shaping the U.S. government’s current system for foreign student visas. In the years after Sept. 11, the federal government fully implemented the automated foreign student monitoring system, and student visa applications started receiving additional scrutiny.
Today, foreign students seeking student visas must be enrolled full-time at schools certified by the federal government. Applications are processed through the U.S. embassy in the student’s home country, where applicants are screened for security risks related to terrorism, health or crime. Currently, no cap exists on the number of F-1 visas that can be issued. Following graduation, students may work in the U.S. under the Optional Practical Training program, which also has no cap.
This analysis assumes students approved for F-1 visas have enrolled for studies at their sponsoring school. Years are based on calendar years. The Carnegie Classification of Institutions was used to categorize public and private schools. Colleges and universities in U.S. territories such as Puerto Rico are included in this analysis.
Data on the number of visas issued in 2017 are not yet available. However, a recent survey of 500 colleges and universities by the Institute for International Education’s Open Doors Report found that the overall average of all newly enrolled international students at those schools has declined by 7% for the 2017-18 academic year.
1 Since the Great Recession, the number of new foreign students enrolled at public colleges and universities has grown faster than at private schools. Enrollments among new foreign students at public higher education institutions grew 107% from 2008 (100,956 students) to 2016 (209,217 students). By comparison, private schools experienced a 98% increase in new foreign students, with enrollment growing from 72,953 in 2008 to 144,697 in 2016.
During this time, overall enrollment declined by less than 1% at public schools and increased 22% at private schools.
2The number of new foreign students pursuing bachelor’s degrees at public universities grew 151% between 2008 and 2016, compared with 3% growth among all public university students. In addition, the number of foreign students pursuing associate degrees at public schools nearly doubled (99%) during this time, compared with a decrease of 19% among all U.S. students pursuing associate degrees.

3Estimated spending by new foreign students at U.S. higher education institutions increased by about 184% from 2008 to 2016. In 2016, foreign students spent an estimated $15.5 billion on higher education – a total that includes tuition, room, board and other expenses – compared with $5.5 billion in 2008. Estimated total spending by foreign students at public universities grew by nearly 214% from 2008 ($2.5 billion) to 2016 ($7.8 billion).
4Graduate degrees are the most common degrees pursued by newly enrolled foreign students. In 2016, almost half (49%) of foreign students pursued graduate-level degrees, such as a master’s (41%) or a doctorate (8%). Other foreign students enrolled in colleges and universities pursued bachelor’s (38%) and associate (13%) degrees.
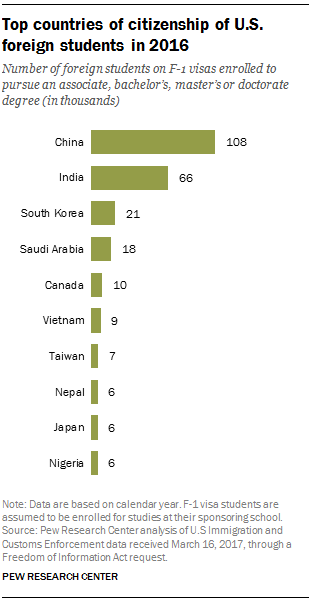
5 Students from China, India and South Korea accounted for more than half (54%) of all new foreign students pursuing higher education degrees in the U.S. in 2016. About 108,000 new students were from China, accounting for 30% of the total. About 66,000 came from India (18% of the total), followed by South Korea with about 21,000 foreign students (6% of the total).
6Ten states accounted for nearly two-thirds (63%) of newly enrolled foreign students in 2016: California, New York, Texas, Massachusetts, Pennsylvania, Illinois, Florida, Ohio, Michigan and Washington. Just two of these states – California (60,000 students) and New York (41,000) – accounted for more than a quarter (28%) of new foreign students enrolled in U.S. colleges and universities. Two states received fewer than 500 foreign students, Wyoming (375) and Alaska (117).


