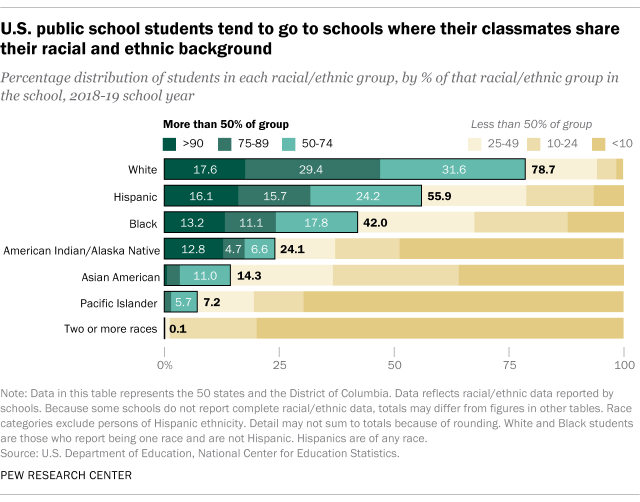
U.S. public school students tend to go to schools where most of the student body shares their racial or ethnic background. Even though this trend has changed somewhat over the last two decades, it remains especially true for White students, a Pew Research Center analysis of U.S. Department of Education data shows.
In the 2018-19 school year, the most recent year for which data is available, 79% of White elementary and secondary public school students went to schools where at least half of their peers were also White. In that year, more than half of Hispanic students (56%) and 42% of Black students also attended schools where half the students or more shared their race or ethnicity. This includes those who attend traditional public schools and public charter schools.
In order to assess the level of racial and ethnic diversity in the nation’s public elementary and secondary schools, this analysis uses federal data to study the state of these schools today and how they have changed over time.
The analysis draws on more than two decades of survey and demographic data from the U.S. Department of Education’s National Center for Education Statistics (NCES), including the Public Elementary/Secondary School Universe Survey and the Common Core of Data.
The analysis uses U.S. public school data from the 2018-19 school year, the most recent data available. It excludes private schools. Public schools include charters, except for the state-level analysis, where traditional public schools and charters are broken out separately.
Data was unavailable for some states due to low response rates or unmet data collection standards.
White, Black, Asian American, Pacific Islander and American Indian or Alaska Natives in this analysis are those who report being one race and are not Hispanic. Hispanics are of any race. Due to methodological changes, earlier NCES data does not include a category for two or more races, and Asian Americans are grouped with Pacific Islanders.
These differences by race and ethnicity do not reflect the demographics of public schools in the country as a whole: White students comprise 47% of students (this has declined from 65% in 1995), while 27% are Hispanic and 15% are Black.
Other racial and ethnic groups make up relatively smaller shares of students, and they are much more likely to go to a school where the majority of their peers are a different race or ethnicity than they are. For Asian Americans – who make up around 5% of all public school students – 86% attend a school where fewer than half of their classmates are Asian, and more than a third (36%) attend a school where fewer than 10% are Asian American. Among Pacific Islanders and American Indians or Alaska Natives, who each account for 1% or fewer of all U.S. students, these shares are even higher.
Shifting demographics over time
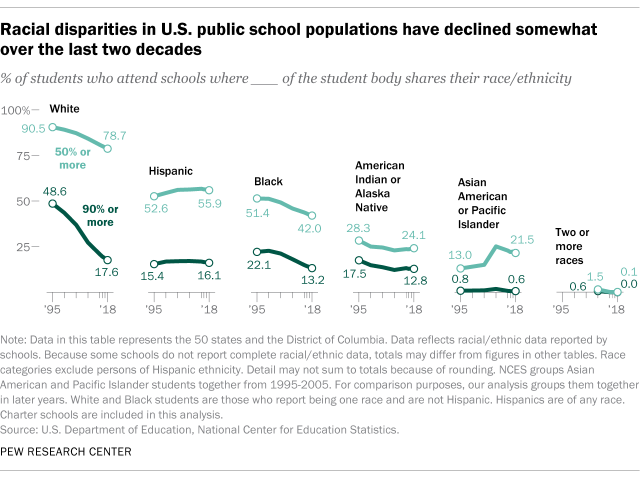
Over the last 25 years or so, White and Black public school students have become somewhat less likely to attend schools where most of the other students share their race.
About nine-in-ten White students (91%) attended a school where half or more of their classmates shared their race in 1995-1996, a share that fell to 79% by the 2018-2019 school year. Among Black students, the share who attended a school where more than half of students were also Black fell from 51% in 1995 to 42% in 2018-2019. During the same time frame, Hispanic students have become slightly more likely to attend a school where at least half of their peers share their ethnicity, rising from 53% in 1995-96 to 56% in 2018-19.
The share of White public school students attending schools where the vast majority of their peers are White also has shrunk over the last quarter century. In 1995, about half of White students (49%) attended schools where at least 90% of students were also White. In 2018, this was the case for just 18% of White students. The share of Black students attending schools where at least 90% of their classmates shared their racial background has also decreased, from 22% in 1995 to 13% in 2018. The percentage of Hispanic students attending schools where at least 90% of students are Hispanic is roughly the same as it was in 1995 – 15% that year, compared with 16% in 2018-19.
These long-term shifts in enrollment are partly the result of the changing racial and ethnic composition of the United States, and, as a result, of its public schools.
Hispanic students account for more than a quarter (27%) of students enrolled in public schools – a share that has roughly doubled since 1995, when they made up 14% of all students. As the share of students who are Hispanic has grown, the share who are Black has decreased slightly, from about 17% during the 1995-96 school year to 15% in 2018-19.
Racial and ethnic makeup of schools by state
In the 2018-19 school year, White students made up 48% of the enrollment in traditional U.S. public schools (excluding charter schools and private schools), accounting for this share or more of students in 34 states. In all but seven states and the District of Columbia, they make up the largest racial or ethnic group in each state’s public schools. Hispanic students are the largest racial or ethnic group in New Mexico (62%), California (55%), Texas (52%), Arizona (47%) and Nevada (44%). Black students make up the highest share in D.C. (59%) and Mississippi (48%). In Hawaii, Asian Americans account for the largest share of students (29%).
Even in states where the public school population is relatively more diverse, children tend to go to schools where their classmates share their racial or ethnic background. In Mississippi, for example, public school students are roughly evenly divided between Black (48%) and White (44%) pupils. In half of the state’s public schools, however, more than 50% of students are Black, and in four-in-ten schools, more than half of students are White.
In Maryland – where 37% of students are White, 32% are Black and 18% are Hispanic – more than a third of the state’s schools (36%) have a population that is more than half White, and in 28% of schools, more than half of students are Black. At 7% of the state’s schools, more than half of students are Hispanic.
The pattern is different for charter schools, which tend to have different racial and ethnic makeups than traditional public schools. Hispanic students account for about a third (34%) of elementary and secondary charter school students, with White students making up 31% and Black students comprising a quarter. In 30 of the 44 states where there is data (including D.C.), White students account for fewer than half of students enrolled in charter schools.
Note: This is an update of a post published Oct. 25, 2017.


