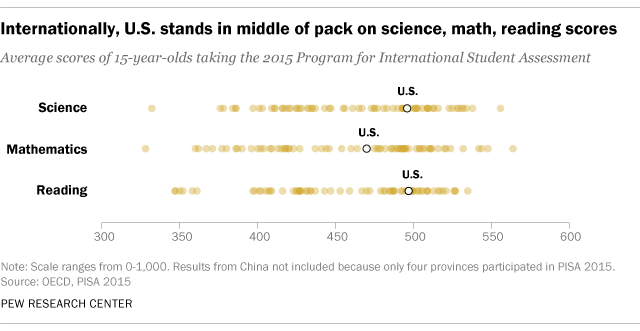
 How do U.S. students compare with their peers around the world? Recently released data from international math and science assessments indicate that U.S. students continue to rank around the middle of the pack, and behind many other advanced industrial nations.
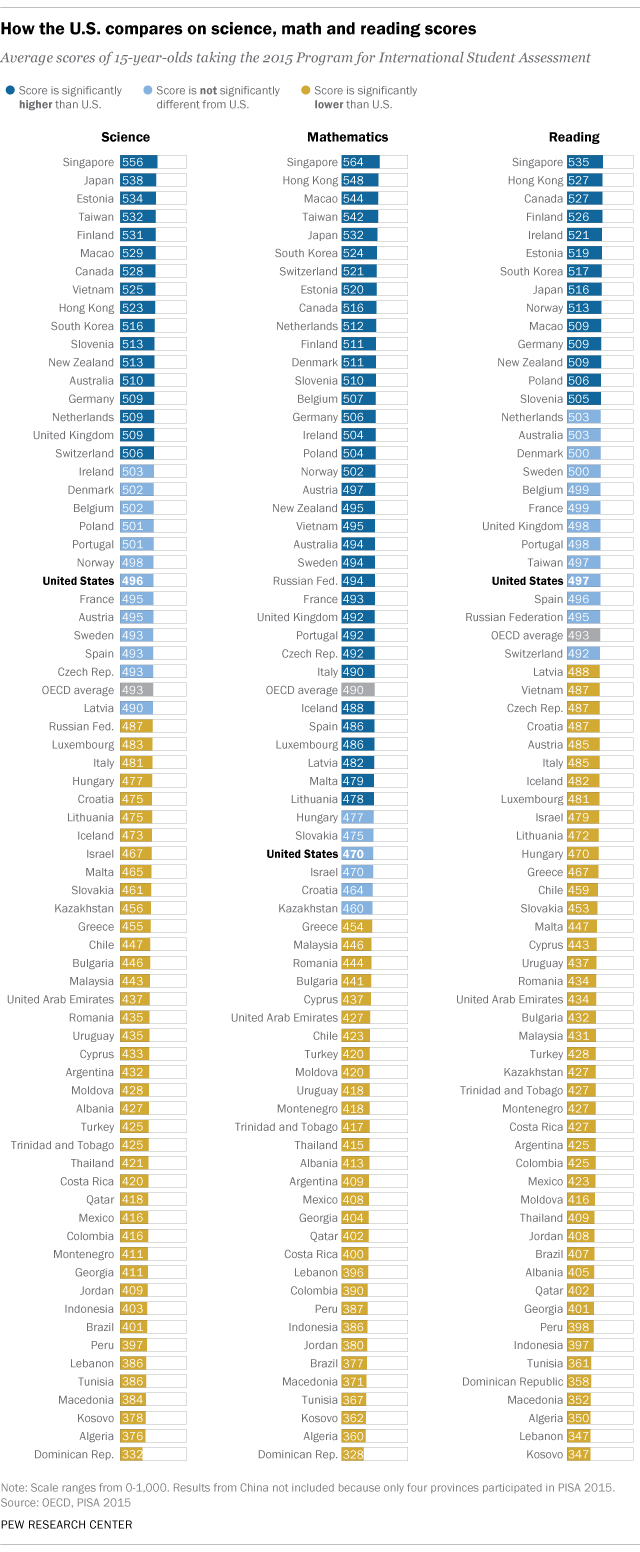
One of the biggest cross-national tests is the Programme for International Student Assessment (PISA), which every three years measures reading ability, math and science literacy and other key skills among 15-year-olds in dozens of developed and developing countries. The most recent PISA results, from 2015, placed the U.S. an unimpressive 38th out of 71 countries in math and 24th in science. Among the 35 members of the Organization for Economic Cooperation and Development, which sponsors the PISA initiative, the U.S. ranked 30th in math and 19th in science.
Younger American students fare somewhat better on a similar cross-national assessment, the Trends in International Mathematics and Science Study. That study, known as TIMSS, has tested students in grades four and eight every four years since 1995. In the most recent tests, from 2015, 10 countries (out of 48 total) had statistically higher average fourth-grade math scores than the U.S., while seven countries had higher average science scores. In the eighth-grade tests, seven out of 37 countries had statistically higher average math scores than the U.S., and seven had higher science scores.
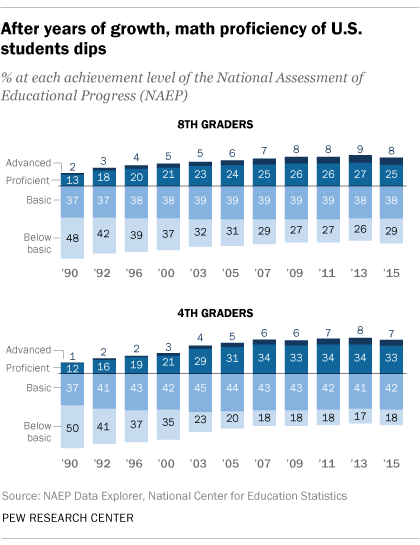
 Another long-running testing effort is the National Assessment of Educational Progress, a project of the federal Education Department. In the most recent NAEP results, from 2015, average math scores for fourth- and eighth-graders fell for the first time since 1990. A team from Rutgers University is analyzing the NAEP data to try to identify the reasons for the drop in math scores.
The average fourth-grade NAEP math score in 2015 was 240 (on a scale of 0 to 500), the same level as in 2009 and down from 242 in 2013. The average eighth-grade score was 282 in 2015, compared with 285 in 2013; that score was the lowest since 2007. (The NAEP has only tested 12th-graders in math four times since 2005; their 2015 average score of 152 on a 0-to-300 scale was one point lower than in 2013 and 2009.)
Looked at another way, the 2015 NAEP rated 40% of fourth-graders, 33% of eighth-graders and 25% of 12th-graders as “proficient” or “advanced” in math. While far fewer fourth- and eighth-graders now rate at “below basic,” the lowest performance level (18% and 29%, respectively, versus 50% and 48% in 1990), improvement in the top levels appears to have stalled out. (Among 12th-graders, 38% scored at the lowest performance level in math, a point lower than in 2005.)
NAEP also tests U.S. students on science, though not as regularly, and the limited results available indicate some improvement. Between 2009 and 2015, the average scores of both fourth- and eight-graders improved from 150 to 154 (on a 0-to-300 scale), although for 12th-graders the average score remained at 150. In 2015, 38% of fourth-graders, 34% of eighth-graders and 22% of 12th-graders were rated proficient or better in science; 24% of fourth-graders, 32% of eighth-graders and 40% of 12th-graders were rated “below basic.”
These results likely won’t surprise too many people. In a 2015 Pew Research Center report, only 29% of Americans rated their country’s K-12 education in science, technology, engineering and mathematics (known as STEM) as above average or the best in the world. Scientists were even more critical: A companion survey of members of the American Association for the Advancement of Science found that just 16% called U.S. K-12 STEM education the best or above average; 46%, in contrast, said K-12 STEM in the U.S. was below average.
 Note: This is an update of a post originally published Feb. 2, 2015. It has been updated to include more recent data.
Related posts:
4 charts on how people around the world see education
Half of Americans think young people don’t pursue STEM because it is too hard


