Pew Research Center published 125 reports and more than 400 blog posts in 2016, covering a wide array of topics, from race and immigration, to the U.S. presidential election and religion. As the year draws to a close, we look back at our research that attracted the most readers, as measured by web visitors to our site.
1. America’s shrinking middle class: A close look at changes within metropolitan areas
The American middle class is shrinking in most metropolitan areas, according to our analysis of government data. From 2000 to 2014, the share of adults living in middle-income households fell in 203 of the 229 U.S. metropolitan areas examined. However, in 119 of the 229 areas, the share of adults in the upper-income tier increased more than the share of adults in the lower-income tier. To see if you are part of the American middle class, use our calculator to find out which income group you are in. The results will compare you first with other adults in your metropolitan area and among American adults overall, and then with other adults in the U.S. similar to you in education, age, race or ethnicity, and marital status.
2. Behind Trump’s victory: Divisions by race, gender, education
In the 2016 election, a wide gap in presidential preferences emerged between those with and without a college degree, our post-election analysis of national exit poll data found. College graduates backed Clinton by a 9-point margin (52%-43%), while those without a college degree backed Trump 52%-44%. This was by far the widest gap in support among college graduates and non-college graduates in exit polls dating back to 1980.
3. Millennials are projected to overtake Baby Boomers as America’s largest generation
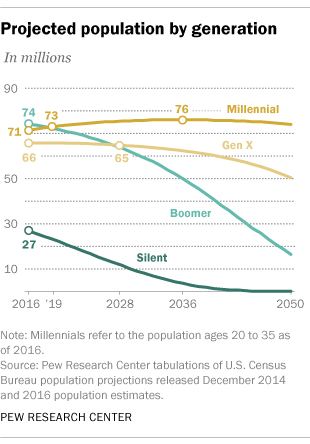 Millennials are projected to surpass Baby Boomers in 2019 as the nation’s largest living adult generation, according to our analysis of U.S. Census Bureau population projections. Millennials, whom we define as those ages 20 to 35 in 2016, now number 71 million, approaching the 74 million Baby Boomers (ages 52 to 70). And Generation X (ages 36 to 51 in 2016) is projected to pass the Boomers in population by 2028. The Millennial generation continues to grow as young immigrants expand its ranks. Boomers – whose generation was defined by the boom in U.S. births following World War II – are older and shrinking as a share of the population as the number of deaths exceeds the number of older immigrants arriving in the country.
Note: Item No. 3 in this post was updated on April 13, 2018, to reflect the Center’s revised definition of the Millennial generation and the updated year in which Millennials will be the largest generation.
4. Trump’s victory another example of how Electoral College wins are bigger than popular vote ones
For the fifth time in U.S. history, and the second time this century, a presidential candidate won the White House while losing the popular vote. This mismatch between the electoral and popular votes came about because Trump won several large states (such as Florida, Pennsylvania and Wisconsin) by very narrow margins, gaining all their electoral votes in the process, even as Clinton claimed other large states (such as California, Illinois and New York) by much wider margins. Trump’s share of the popular vote, in fact, was the seventh-smallest winning percentage since 1828, when presidential campaigns began to resemble those of today.
5. On views of race and inequality, blacks and whites are worlds apart
Our 2016 survey found profound differences between black and white adults in their views on racial discrimination, barriers to black progress and the prospects for change. Blacks, far more than whites, say black people are treated unfairly across different realms of life, from dealing with the police to applying for a loan or mortgage. And, for many blacks, racial equality remains an elusive goal. An overwhelming majority (88%) of blacks say the country needs to continue making changes for blacks to have equal rights with whites, but 43% are skeptical that such changes will ever occur. Among whites, 53% say the country still has work to do for blacks to achieve equal rights with whites, but only 11% express doubt that these changes will come.
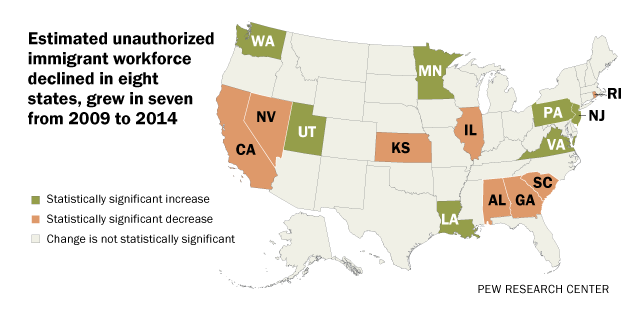
6. Size of U.S. unauthorized immigrant workforce stable after the Great Recession
There were 8 million unauthorized immigrants in the U.S. working or looking for work in 2014, making up 5% of the civilian labor force, according to our most recent estimates using government data. The number was unchanged and the share was down slightly since 2009, the year the Great Recession officially ended. The recent stability in the trend for unauthorized immigrants in the U.S. workforce echoes that for the unauthorized immigrant population overall.
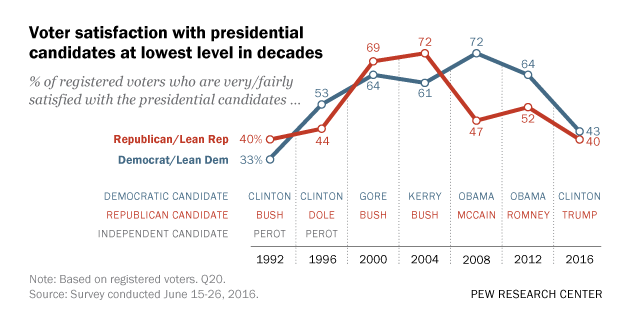
7. 2016 campaign: Strong interest, widespread dissatisfaction
As Republicans and Democrats prepared for their party conventions in June, our national survey painted a bleak picture of voters’ impressions of the presidential campaign and the choices they faced in November. Overall satisfaction with the candidates was at its lowest point in two decades and roughly four-in-ten voters told us it was difficult to choose between Donald Trump and Hillary Clinton because neither would make a good president – as high as at any point since 2000. The presidential campaign was also widely viewed as excessively negative and not focused on important issues.
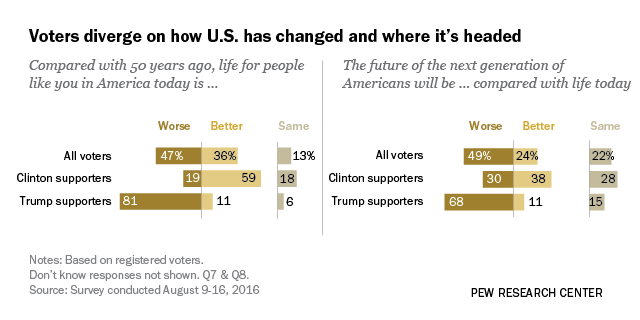
8. Clinton, Trump supporters have starkly different views of a changing nation
Our August survey revealed a wide gulf in how Donald Trump and Hillary Clinton supporters viewed the country. It found Donald Trump supporters overwhelmingly believed that life in America is worse than it was 50 years ago “for people like them,” while most Hillary Clinton supporters took the opposite view, saying life for people like them has gotten better over the past half-century. The candidates’ supporters also differed in their expectations for the nation’s future. Trump backers were broadly pessimistic, while Clinton supporters had mixed assessments.
Estimating the number of atheists in the U.S. is complicated. Some adults who describe themselves as atheists also say they believe in God or a universal spirit. At the same time, some people who identify with a religion (e.g., say they are Protestant, Catholic or Jewish) also say they do not believe in God.
But one thing is for sure: Along with the rise of religiously unaffiliated Americans (many of whom believe in God), there has been a corresponding increase in the number of atheists. Our June 2016 blog post rounded up key facts about atheists and their beliefs.
10. Presidential job approval ratings from Ike to Obama
“Do you approve or disapprove of the way ____ is handling his job as president?”
Our January 2016 blog post looked at Pew Research Center presidential approval data going back to Bill Clinton, and Gallup data going back to Dwight Eisenhower. These ratings reflect how the public’s views of presidents have become more politically polarized, as well as how key events in U.S. history have helped shape positive and negative views of our commanders in chief.
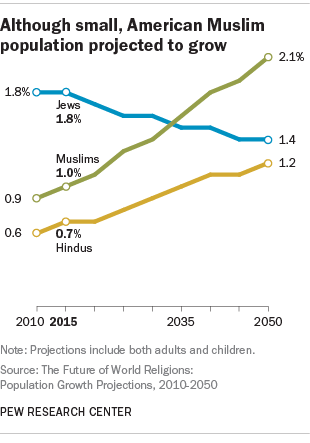
11. A new estimate of the U.S. Muslim population
In 2015, there were about 3.3 million Muslims of all ages living in the United States, according to our January 2016 estimate. This means that Muslims made up about 1% of the total U.S. population (about 322 million people in 2015), and we estimated that that share will double by 2050.
Our new estimate of Muslims and other faiths was based on a demographic projection that models growth in the American Muslim population since our 2011 estimate and includes both adults and children. The projection uses data on age, fertility, mortality, migration and religious switching drawn from multiple sources, including the 2011 survey of Muslim Americans.
12. U.S. religious groups and their political leanings
Mormons are the most heavily Republican-leaning religious group in the U.S., while a pair of major historically black Protestant denominations – the African Methodist Episcopal (AME) Church and the National Baptist Convention – are two of the most reliably Democratic groups, according to our February blog post based on data from Pew Research Center’s 2014 Religious Landscape Study.
13. State of the news media 2016
 Our annual State of the News Media report documented a tumultuous time for the news industry across a variety of key audience, employment and economic measures. The print newspaper industry had perhaps its worst year since the recession and its immediate aftermath, while the cable, network and local TV news sectors also face serious challenges despite experiencing robust growth in a number of areas.
14. Most Americans already feel election coverage fatigue
 Our July blog post struck a chord with many Americans exhausted by the amount of election coverage. At the time, the November election was still about four months away, yet most Americans told us they were already worn out by election news. This feeling of fatigue was particularly true among those who weren’t following news about the election very closely – 69% of this group said they were worn out compared with about 41% of those who were following the election very closely.
When asked about various topics of campaign coverage, two areas stood out for being over-covered: About four-in-ten said there was too much coverage of candidates’ comments on the campaign trail and of their personal lives, higher than any other topics asked about. There was only one topic that most Americans said had received too little coverage – candidates’ stances on issues.
15. Muslims and Islam: Key findings in the U.S. and around the world
How many Muslims are there? Where do they live? Why is the global Muslim population growing? What do Muslims around the world believe? Our July blog post provided answers to these and other questions about Muslims, based on Pew Research Center findings from recent years.
Note: Item No. 3 in this post was updated on April 13, 2018.
To keep up with our research throughout the year, you can sign up for our newsletter, follow us on Twitter, or like us on Facebook.


