Gay, lesbian and bisexual voters may make up a relatively small share of the American electorate – just 5% of voters in the 2012 general election identified as LGB, according to national exit polls – but they have long been a deeply Democratic constituency and today are overwhelmingly negative in their assessments of Donald Trump.
 Nearly nine-in-ten LGB voters (89%) give the Republican presidential nominee a rating of cold on a “feeling thermometer” that ranges from 0 (the coldest, most negative rating) to 100 (the warmest, most positive score). About eight-in-ten (82%) rate Trump very cold, including more than half (54%) who give him a score of 0. Just 9% of LGB voters rate Trump warm.
By contrast, Hillary Clinton is viewed generally positively: 61% of LGB voters rate her warm, including 36% who rate her very warm. About three-in-ten (31%) give her a cold rating, including 24% who have a very cold view of the Democratic nominee.
This analysis is based on data from Pew Research Center’s nationally representative American Trends Panel. The survey was conducted online from Sept. 27 to Oct. 10 among 4,132 adults, including 3,616 registered voters (167 of whom identify as lesbian, gay or bisexual).
The presidential vote preferences of LGB voters this year are largely consistent with past elections. Nearly three-quarters of LGB voters (72%) back Clinton and just 13% back Trump, while 7% support Libertarian candidate Gary Johnson and 8% back Green Party candidate Jill Stein. According to national exit polls, about three-quarters of LGB voters (76%) voted for Barack Obama in the 2012 election, while 22% voted for Mitt Romney. And in 2014 midterm exit polls, LGB voters favored Democratic candidates by a similar margin (75% to 24%).
 LGB voters’ Democratic leanings are also on par with recent years. About eight-in-ten LGB registered voters (82%) now identify with or lean to the Democratic Party, while 18% identify with or lean to the GOP. This party balance is similar to patterns seen in a 2013 Pew Research Center survey of LGBT adults in which 79% of LGBT adults identified or leaned Democratic and 18% identified or leaned Republican.
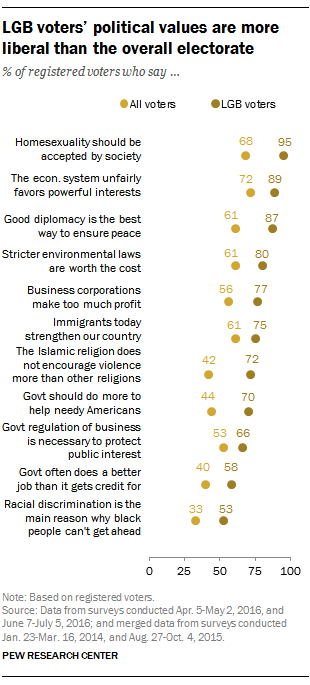
LGB voters are not only strong supporters of Democratic candidates; they also tend to have broadly liberal political values on a variety of topics, in some cases differing significantly from the views of the electorate as a whole. For example, 58% of LGB voters say government often does a better job than it gets credit for and 40% say it is inefficient and wasteful; but voters as a whole have the inverse view, with 40% saying the government does a better job than it gets credit for while 58% say it is inefficient and wasteful. On immigration, three-quarters of LGB voters (75%) say immigrants do more to strengthen the country than pose a burden (22%), compared with 61% of all voters who say immigrants do more to strengthen the country than pose a burden (32%).
Note: Data in this post are based on self-identification as lesbian, gay or bisexual. This analysis does not include transgender voters (unless they also identify as LGB). Gender identity is measured separately from self-identified sexual orientation, and the American Trends Panel does not currently measure transgender identity. Overall, transgender adults make up a relatively small share (roughly 5%) of the LGBT population.


