 Note: For 2018 data on views of the death penalty, click here.
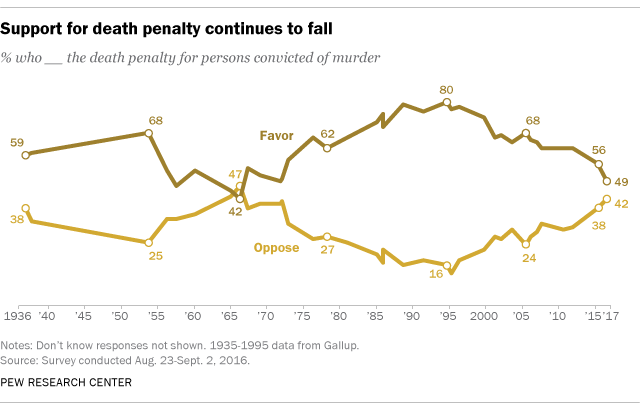
As the Supreme Court prepares to hear the first of two death penalty cases in this year’s term, the share of Americans who support the death penalty for people convicted of murder is now at its lowest point in more than four decades.
Only about half of Americans (49%) now favor the death penalty for people convicted of murder, while 42% oppose it. Support has dropped 7 percentage points since March 2015, from 56%. Public support for capital punishment peaked in the mid-1990s, when eight-in-ten Americans (80% in 1994) favored the death penalty and fewer than two-in-ten were opposed (16%). Opposition to the death penalty is now the highest it has been since 1972.
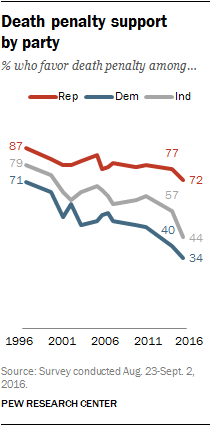
 Though support for the death penalty has declined across most groups, a Pew Research Center survey conducted Aug. 23-Sept. 2 among 1,201 adults finds that most Republicans continue to largely favor its use in cases of murder, while most Democrats oppose it. By more than two-to-one, more Republicans (72%) than Democrats (34%) currently favor the death penalty.
Two decades ago, when majorities in both parties favored the death penalty, the partisan gap was only 16 percentage points (87% of Republicans vs. 71% of Democrats).
And, for the first time in decades, independents are as likely to oppose the use of the death penalty (45%) as they are to favor it (44%). The share of independents who support capital punishment has fallen 13 points since last year (from 57%).
This shift in views among independents is particularly pronounced among those who lean toward the Democratic Party (a 10-point decrease in support) and those who do not lean to either party (down 16 points). Support for the death penalty among independents who lean toward the GOP is little changed from March 2015 (73% now, 70% then).
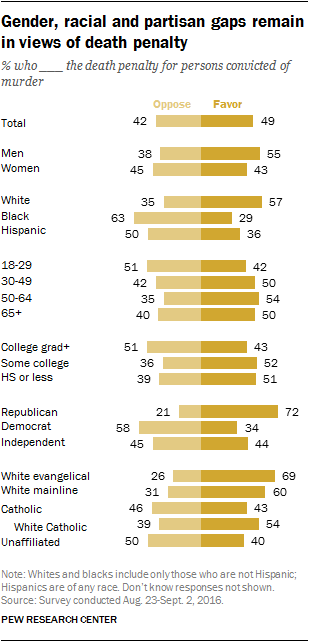
 Even as support for the death penalty has declined across nearly all groups, demographic differences remain: Men are more likely to back the use of the death penalty than women, white Americans are more supportive than blacks and Hispanics, and attitudes on the issue also differ by age, education and along religious lines.
More than half of men (55%) say they are in favor of the death penalty and 38% are opposed. Women’s views are more divided: 43% favor the death penalty, 45% oppose it.
A 57% majority of whites favor the death penalty for those convicted of murder (down from 63% last year). But blacks and Hispanics support it at much lower rates: Just 29% of blacks and 36% of Hispanics favor capital punishment.
There are only modest difference by age and education in support for the death penalty, with 18- to 29-year-olds somewhat less likely to support it (42% favor) than those in older age groups (51% of those 30 and older). Those without a college degree are more likely than those with at least a college degree to favor the use of the death penalty in cases of murder (51% vs. 43%).
White evangelical Protestants continue to back the use of the death penalty by a wide margin (69% favor, 26% oppose). White mainline Protestants also are substantially more likely to support (60%) than oppose (31%) the death penalty. But among Catholics and the religiously unaffiliated, opinion is more divided: 43% of Catholics favor capital punishment, while 46% oppose it. And while 50% of those who are religiously unaffiliated oppose the death penalty, 40% support it.
A more detailed study last year of attitudes toward capital punishment found that 63% of the public thought the death penalty was morally justified, but majorities said there was some risk of an innocent person being put to death (71%) and that the death penalty does not deter serious crime (61%).
Note: View the methodology for the Aug. 23-Sept. 2 survey and the topline. (PDF).


