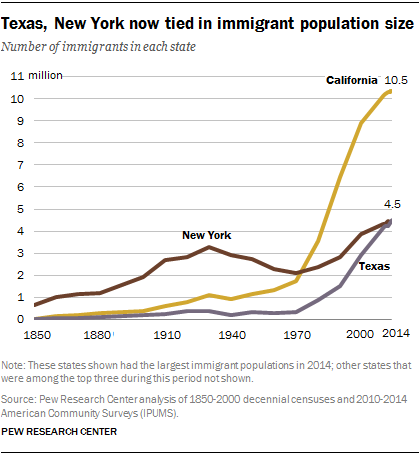
 The immigrant population in Texas has grown rapidly in recent decades, reaching 4.5 million in 2014. That puts Texas in a tie with New York for the second largest state immigrant population by size.
New York had the largest immigrant population of any state from 1850 to 1970, according to a Pew Research Center analysis of U.S. Census Bureau data.
But in the 1970s, things changed as immigration from Mexico began to surge. By 1980, California overtook New York as the state with the most immigrants, after more than doubling its immigrant population in a decade. In 2014, California’s immigrant population was the largest in the country, numbering 10.5 million – more than twice the size of New York’s and Texas’.
Florida, Illinois, New Jersey, Ohio and Pennsylvania were also among the top three immigrant states at times between 1850 and 2014. For example, Pennsylvania was among the top three for a century (from 1850 to 1950). And Illinois consistently had the third largest immigrant population between 1870 and 1940.
Today’s top three immigrant states account for nearly half of the immigrant population in the U.S. A quarter of U.S. immigrants live in California while 11% live in Texas and another 11% live in New York.
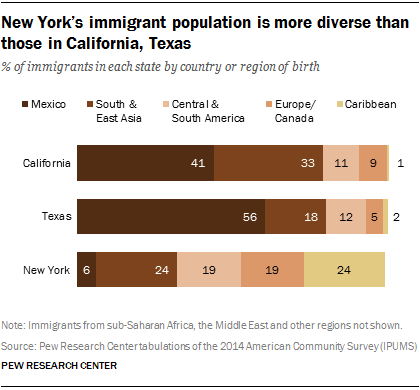
 While New York is no longer the home to the largest number of immigrants, its immigrant population is more diverse than those of California or Texas. Large shares of California’s and Texas’ immigrant populations are from Mexico and South and East Asia. By contrast, about a quarter of immigrants in New York are from the Caribbean (24%) and another 24% are from South and East Asia. Another 19% are from Europe or Canada and Central and South America, each. Only 6% of immigrants in New York are from Mexico.
The top country of origin among immigrants in Texas and California has long been Mexico. Mexico was the largest source of migration for Texas’ immigrant population since 1870 and the largest for California since 1930.

For New York, though, the top country of origin has changed over time as different waves of immigrants arrived in the U.S. From 1850 to 1880, immigrants from Ireland outnumbered those of any other country in New York. But Italy took the lead by 1930, and this changed again between 1990 and 2014, when more immigrants from the Dominican Republic lived in New York than any other group.
The characteristics of the immigrant population in these states also differ substantially. For example, about a quarter of New York’s immigrant population ages 5 and older say that they speak only English at home, compared with about one-in-ten in California and Texas. And immigrants in Texas are considerably less likely to have U.S. citizenship than those in New York and California (35% versus 55% and 49%, respectively). Immigrants in New York and California are more likely to have lived in the U.S. for more years than immigrants in Texas, which may in part contribute to these differences.
A statistical portrait of the nation’s foreign-born population is available here that features detailed characteristics of the foreign-born population at the national level, as well as state population totals from 1960 to 2014. You can also access a statistical portrait of the nation’s Hispanic population that documents key demographic and economic trends of this population from 1980 to 2014.


