Over the past year, Pew Research Center conducted an experiment to see if the mode by which someone was surveyed – in this case, a telephone survey with an interviewer versus a self-administered survey on the Web – would have any effect on the answers people gave. We used two randomly selected groups from our American Trends Panel to do this, asking both groups the same set of 60 questions.

The result? Overall, our study found that it was fairly common to see differences in responses between those who took the survey with an interviewer by phone and those who took the survey on their own (self-administered) online, but typically the differences were not large. There was a mean difference of 5.5 percentage points and a median difference of 5 points across the 60 questions.
But there were three broad types of questions that produced larger differences (known as mode effects) between the responses of those interviewed by phone vs. Web. These differences are noteworthy given that many pollsters, market research firms and political organizations are increasingly turning to online surveys which, compared with phone surveys, are generally less expensive to produce and faster in yielding results.
Here are three of the areas that showed the biggest mode gaps in responses from the phone and Web groups in our study:
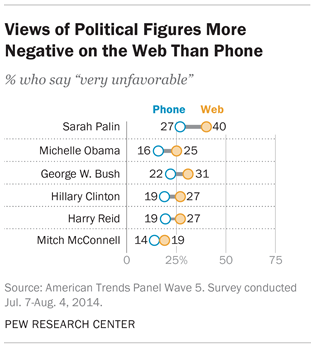
 1People expressed more negative views of politicians in Web surveys than in phone surveys. Those who took Web surveys were far more likely than those interviewed on the phone to give various political figures a “very unfavorable” rating. This tendency was especially concentrated among members of the opposite party of each figure rated. Hillary Clinton’s ratings are a good example of this pattern. When asked on the phone, 36% of Republicans and those who lean Republican told interviewers they had a “very unfavorable” opinion of Clinton, but that number jumped to 53% on the Web. However, as with most of the political figures, Clinton’s positive ratings varied only modestly by mode – 53% rated her positively on the Web, compared with 57% on the phone.
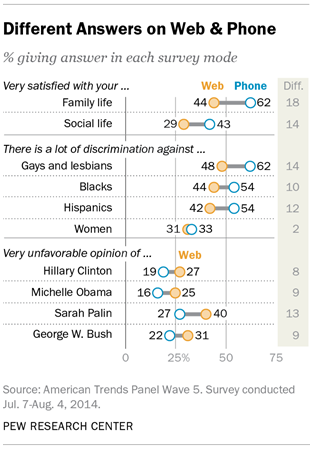
The same patterns seen with Clinton were also evident for Republican political figures. Web respondents were 13 points more likely than phone respondents to have a “very unfavorable” view of Sarah Palin. Among Democrats and Democratic leaners, 63% expressed a very unfavorable view of Palin on the Web, compared with only 44% on the phone.
2People who took phone surveys were more likely than those who took Web surveys to say that certain groups of people – such as gays and lesbians, Hispanics, and blacks – faced “a lot” of discrimination. Here, the impact of the mode of interview varied by the race and ethnicity of the respondents.
 When asked about discrimination against gays and lesbians, 62% of respondents on the phone said they faced “a lot” of discrimination, but only 48% gave the same answer on the Web. The mode effect on this question appeared among both Democrats and Republicans.
Telephone survey respondents were also more likely than Web respondents to say that Hispanics faced “a lot” of discrimination (54% in the phone survey, 42% in the Web survey). There was also a difference in response by mode among Hispanics questioned for this study: 41% on the Web said they faced discrimination, while 61% on the phone said this. The mode difference for white respondents was 14 points. But among black respondents, there was no significant mode effect: 66% of blacks interviewed by phone said Hispanics face a lot of discrimination, while 61% of those interviewed on the Web said the same.
When asked about discrimination against blacks, more phone respondents (54%) than Web respondents (44%) said they faced a lot of discrimination. This pattern was clear among whites, where 50% on the phone and just 37% on the Web said blacks faced a lot of discrimination. But among blacks, the pattern was reversed: 71% of black respondents interviewed by phone say they faced “a lot” of discrimination, while on the Web 86% gave this answer.
3People were more likely to say they are happy with their family and social life when asked by a person over the phone than when answering questions on the Web. Among phone survey respondents, 62% said they were “very satisfied” with their family life, while just 44% of Web respondents said this. Asked about their social life, 43% of phone respondents said they were very satisfied, while just 29% of Web respondents gave that answer. These sizable differences are evident among most social and demographic groups in the survey.
Respondents were also asked how satisfied they were with their local community as a place to live. Phone respondents were again more positive, with 37% rating their community as an excellent place to live, compared with 30% of Web respondents. But there was no significant difference by mode in the percentage who gave a negative rating of their community (“only fair” or “poor”).
So, what’s going on here? These examples are consistent with the theory that when people are interacting with an interviewer, they are more likely to give answers that paint themselves or their communities in a positive light, and less likely to portray themselves negatively. This appears to be the case with the questions presenting the largest differences in the study – satisfaction with family and social life, as well as questions about the ability to pay for food and medical care. These findings are consistent with other research that has found that when there is a human interviewer, respondents tend to give answers that would be considered more socially desirable – a phenomenon known as the “social desirability bias.”
On the political questions, however, other recent research has suggested that when interviewers are presenting the questions, respondents may choose answers that are less likely to produce an uncomfortable interaction with the interviewer. This dynamic may also be in effect among black respondents on the phone who – compared with those surveyed on the Web – are less likely to tell an interviewer that blacks face a lot of discrimination. In the interest of maintaining rapport with an interviewer, respondents may self-censor or moderate their views in ways that they would not online.
Altogether, our findings suggest that there may be advantages to online surveys, particularly if the survey seeks to measure topics that are sensitive or subject to social desirability because of the willingness of respondents to express more negative attitudes about their personal lives or toward political figures on the Web.
That said, researchers need to carefully consider the trade-offs between the two survey modes. This study only looked at differences in how people answer questions differently online and over the phone. But the survey mode can affect what kinds of people are included in the survey as well. Telephone surveys continue to provide access to survey samples that are broadly representative of the general public, even in the face of declining response rates. Many Americans still lack reliable access to the internet, and traditional phone surveys have been found to perform better than many probability-based Web surveys among some respondents, including financially struggling individuals, those with low levels of education, and minorities with low language proficiency. Given these trade-offs, we are continuously working to make our traditional methods even more robust in addition to exploring new methods for understanding public opinion.


