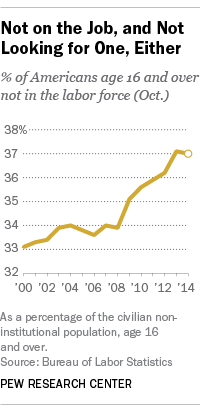
 According to the October jobs report, more than 92 million Americans — 37% of the civilian population aged 16 and over — are neither employed nor unemployed, but fall in the category of “not in the labor force.” That means they aren’t working now but haven’t looked for work recently enough to be counted as unemployed. While that’s not quite a record — figures have been a bit higher earlier this year — the share of folks not in the labor force remains near all-time highs.
Why? You might think legions of retiring Baby Boomers are to blame, or perhaps the swelling ranks of laid-off workers who’ve grown discouraged about their re-employment prospects. While both of those groups doubtless are important (though just how important is debated by labor economists), our analysis of Bureau of Labor Statistics data suggests another key factor: Teens and young adults aren’t as interested in entering the work force as they used to be, a trend that predates the Great Recession.
By far the biggest chunk of people not in the labor force are people who simply don’t want to be, according to data from the monthly Current Population Survey (which the BLS uses to, among other things, calculate the unemployment rate). Last month, according to BLS, 85.9 million adults didn’t want a job now, or 93.3% of all adults not in the labor force. (All of the figures we’re using in this post are unadjusted for seasonal variations.)
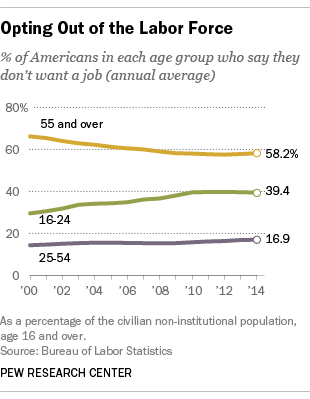
 But let’s look in particular at the youngest part of the eligible workforce. The share of 16- to 24-year-olds saying they didn’t want a job rose from an average 29.5% in 2000 to an average 39.4% over the first 10 months of this year. There was a much smaller increase among prime working-age adults (ages 25 to 54) over that period. And among people aged 55 and up, the share saying they didn’t want a job actually fell, to an average 58.2% this year.
People 55 and over do, as you might expect, account for more than half of the 85.9 million adults (as of October) who say they don’t want a job — about the same percentage as in 2000. But the 16-to-24 share has edged higher, while the 25-to-54 share has slipped. That could reflect more young adults staying in or returning to school rather than chancing a tough job market.
Women are more likely than men to say they don’t want a job, although the gap has been narrowing — especially since the Great Recession. Last month, 28.5% of men said they didn’t want a job, up from 23.9% in October 2000 and 25.2% in October 2008. For women, the share saying they didn’t want a job hovered around 38% throughout the 2000s but began creeping up in 2010, reaching 40.2% last month.
Researchers disagree about why people leave the labor force and how likely they are ever to return. In a report issued in February, the Congressional Budget Office estimated that about half the decline in labor-force participation was due to long-term demographic trends, a third was due to cyclical weaknesses in the labor market, and the rest a consequence of “unusually protracted weakness in the demand for labor [which] appears to have led some workers to become discouraged and permanently drop out of the labor force,” such as by taking early retirement or signing up for Social Security disability benefits. But two Federal Reserve economists have argued that cyclical factors, rather than demographic shifts, account for the bulk of the drop in labor-force participation since 2007.
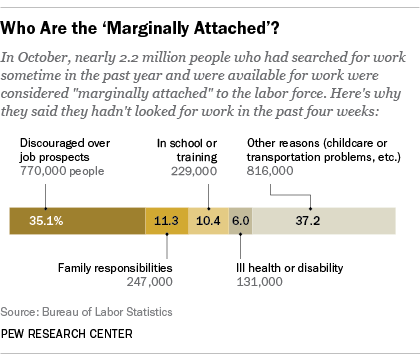
 Economists are especially interested in the subset of non-participants who are considered “marginally attached” to the labor force. Those people aren’t counted as unemployed, because they haven’t looked for work in the past four weeks, but they have job-hunted sometime in the past year and say both that they want a job and are available to take one right away. Many labor economists believe marginally attached people are most likely to be drawn back into the labor force.
The number of discouraged workers — those who’ve not searched for work recently because they don’t think they’ll find any — spiked during and after the Great Recession, peaking at 1.3 million in December 2010. Though that number has come down since, October’s estimate of 770,000 discouraged workers was still well above pre-recession levels, which typically hovered around 400,000 to 500,000.
But discouraged workers make up only about 35% of all marginally attached workers, and account for just over half the increase in their ranks since the 2008 financial panic. The rest of the marginally attached cite a range of reasons for not having looked for work recently, including family responsibilities, being in school, ill health, and problems with child care or transportation.


