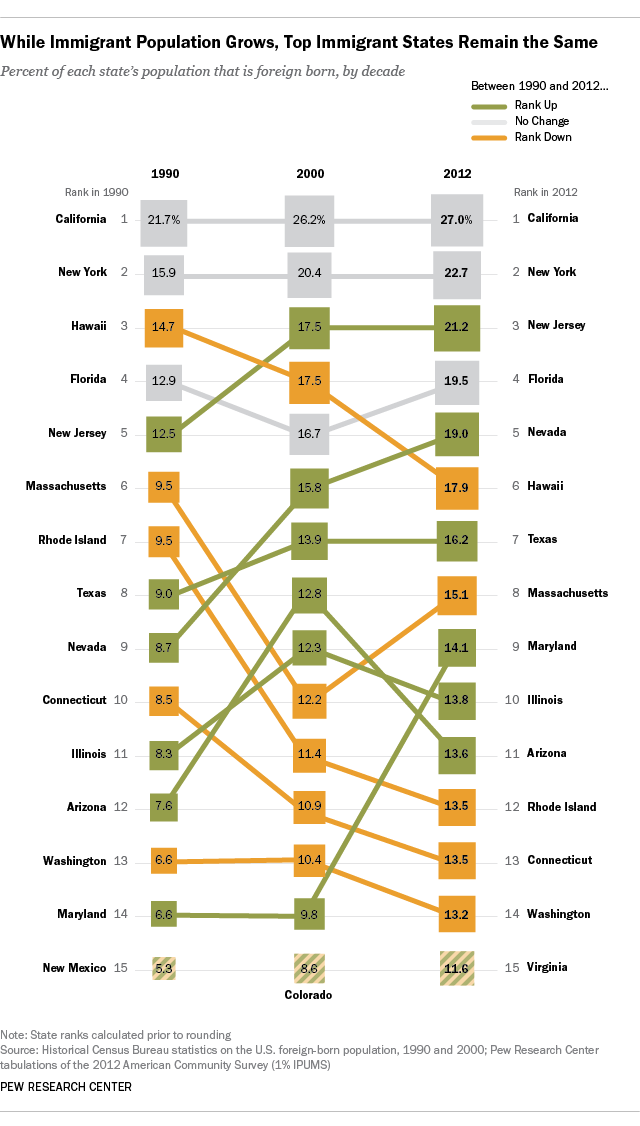
 A sharp rise in the number of immigrants living in the U.S. in recent decades serves as a backdrop for the debate in Congress over the nation’s immigration policies. In 1990, the U.S. had 19.8 million immigrants. That number rose to a record 40.7 million immigrants in 2012, among them 11.7 million unauthorized immigrants.
Over this period, the number of immigrants in the U.S. increased more than five times as much as the U.S.-born population (106.1% versus 19.3%), according to a Pew Research Center analysis of Census Bureau data. As a result, from 1990 to 2012, the share of immigrants in the entire U.S. increased from 7.9% in 1990 to 13.0% in 2012.
Today there are four states in which about one-in-five or more people are foreign born—California, New York, New Jersey and Florida. By contrast, in 1990, California was the only state to have more than a fifth of its population born outside the U.S.
The 15 states where immigrants made up the biggest share of the population in 2012 account for about eight-in-ten (79%) of the nation’s immigrants. Although the rankings have changed over the past few decades, almost all of the states that have the highest immigrant population shares have remained the same.
The number of immigrants have risen so quickly in some parts of the country that states typically thought of as hubs of immigration, such as Arizona, have slipped behind other states by some measures. In 2000, immigrants made up 12.9% of Arizona’s population, ninth-highest in the nation that year. By 2012, Arizona had dropped to 12th-highest, even though immigrants made up a higher share—13.6%—of the state’s population.


