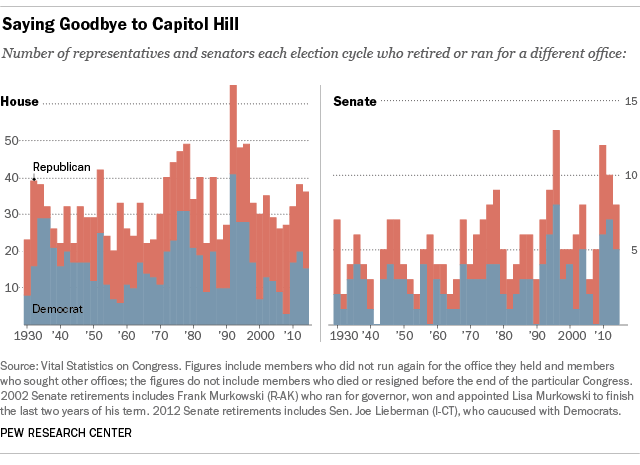
 Monday’s retirement announcement by Rep. John Dingell, the longest-serving member of Congress in history, brings to 40 the number of sitting House members (or 9.2%) who, for various reasons, aren’t seeking reelection this fall. That level is in line with historic levels of House turnover, but the impending retirements of several other long-serving members will collectively subtract more than 600 years of legislative experience from the chamber.
By our count, 20 representatives have said they’ll retire from the House; 16 more are running for other offices, from Senate (including three Georgia congressmen) to lieutenant governor to San Bernardino County, Calif., supervisor. That’s 36 who are retiring or seeking other office, one fewer than the average for the past 21 election cycles, according to analysis of data from Vital Statistics on Congress, an invaluable reference guide produced by the Brookings Institution and the American Enterprise Institute. (Three representatives elected or re-elected in 2012 have resigned, and one has died; none have yet been replaced via special election.)
Two years ago, according to Vital Statistics, 38 representatives either retired or ran for some other office instead of their House seat. Since 1930, the year with the highest House turnover was 1992, the year the House banking and post office scandals broke. 65 representatives retired or ran for something else that year; while that might have counted as an “exodus,” this year’s departures do not.
Along with Dingell, who’s serving his 59th year in the House, several other long-serving representatives are calling it quits this year. They include California Democrats George Miller and Henry Waxman (both first elected in 1974), Virginia Republican Frank Wolf (first elected in 1980) and North Carolina Republican Howard Coble (first elected in 1984). In addition, Florida Republican C.W. “Bill” Young was serving his 22nd term when he died this past October. All in all, at least 644 years of seniority will be leaving the House come January 2015.
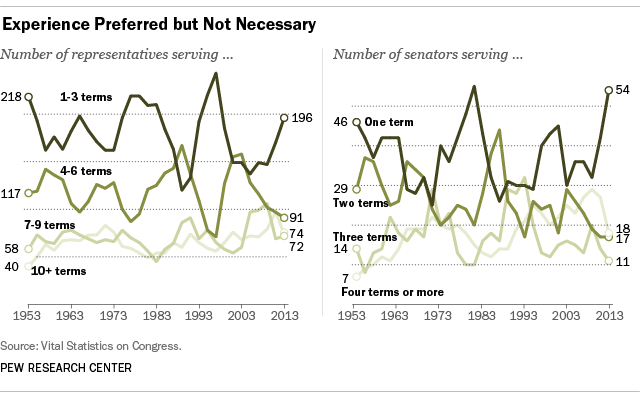
 For most of the past 60 years, the overall experience level of the House has varied within a narrow range: The average length of service was typically between five and six terms, while the median was four or five terms. Over the past few election cycles, though, the share of less-experienced representatives (those in their first through third terms) has risen significantly. In 2009, 147 representatives (33.8% of the entire body) had six years or less of House experience; by 2013 that had risen to 196, or 45%.
The shift has been even more pronounced in the Senate: 54 senators are in their first term, the most since the 97th Congress in 1981. The average length of service has fallen from 14 years in 2009 to less than 10 years in the current Congress; the median length of service in the Senate, six years, is the lowest it’s been since 1981.


