 Marriage is back – at least, a little bit, and with some caveats. Recently released Census data indicate that the number of new marriages in the U.S. went up in 2012, reversing a three-year decline. Since marriage is tied to economic mobility, some economists may interpret this development as a small sign that shows the U.S. economy is improving. But a closer look at the data shows some reason for caution.
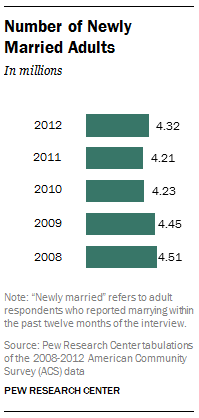
The new data show that 4.32 million adults (ages 18 or older) were newlywed in 2012, a 3% percent increase over the 4.21 million adults newly married in 2011. (The data do not include same-sex couples.)
Is the uptick in newly married adults due to the national economic recovery that officially began in June 2009? It is certainly possible. There’s already a fairly vigorous debate about to what extent marriage and divorce are affected by economic activity. Some researchers have shown that marriage rates did not decline significantly during the Great Recession. And others have cautioned that it is difficult to conclude that the recession accelerated the retreat from marriage , so it seems premature to assert too much from the new data.
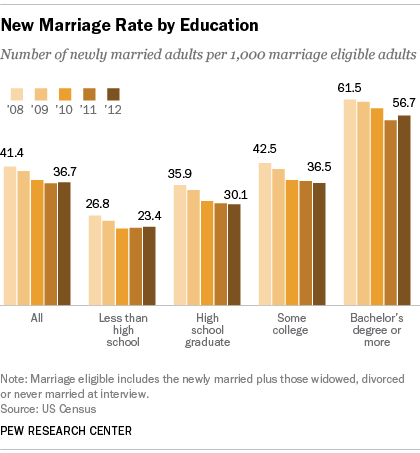
 But a closer look at the demographic patterns reveals some interesting insights about who is getting married. From 2011 to 2012, the total number of newly married adults increased by 113,000 (from 4.21 million to 4.32 million). Examining the newlyweds by education level, the number of newly married adults with at least a bachelor’s degree increased by 98,000 from 2011 to 2012. Thus, almost the entire increase in new marriages (87%) from 2011 to 2012 is accounted for by the college-educated.
The new marriage rate among college-educated adults increased from 55.3 newlyweds per thousand eligible adults in 2011 to 56.7 newly married in 2012. In contrast, the new marriage rate among adults with some college education and adults with a high school diploma fell further from 2011 to 2012.
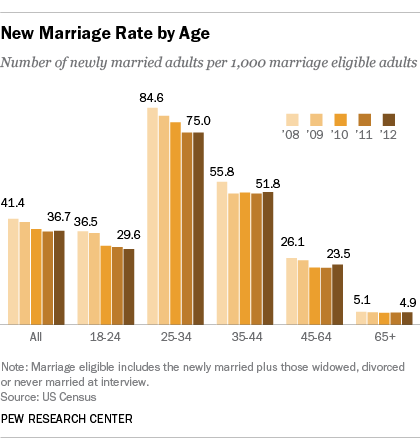
 By age, the uptick in new marriages is concentrated among adults ages 35 and older. The prime age for getting hitched is 25 to 34. In 2012 there were 75.0 newly married 25- to 34-year-olds for every thousand eligible. The new marriage rate for this prime demographic was also 75.0 in 2011. In contrast, the new marriage rate for age groups older than 34 did increase from 2011 to 2012. For example, among adults between the ages of 35 to 44, 51.8 were newly married per thousand eligible in 2012, an increase from 51.2 per thousand eligible in 2011.
We know from the Census’s Current Population Survey that young adults are pushing back the age at which they first marry. The Census Bureau reported in November 2013 that the median age at first marriage for men was 29.0 in 2013, up from 28.6 in 2012. In 2013, the median age at first marriage for women was 26.6 and has remained about the same over the same period.
How does the one year change in the number of newlyweds fit into the larger context of marriage trends in America? The new marriage data provide insights on entry into marriage and not the stability of marriage. The long-run trends on entry into marriage clearly show that less-educated adults have become less likely to ever get married. Consider marital outcomes among 35- to 39-year-olds. In 2012, 73% of 35- to 39-year-olds without a bachelor’s degree had ever married. By contrast, 92% of this group had ever married in 1950.
Among college-educated adults, it is not clear that they are less likely to pursue marriage than earlier cohorts. In 2012, 81% of college-educated 35- to 39-year-olds had ever married. Whether marriage has lost its attraction for the college-educated depends on how far back one tracks it. In 1950, for example, only 76% of college-educated 35- to 39-year-olds had ever been married.
So the recent slide in new marriages among less-educated adults is part of a long-run decline in entry into marriage among these adults.

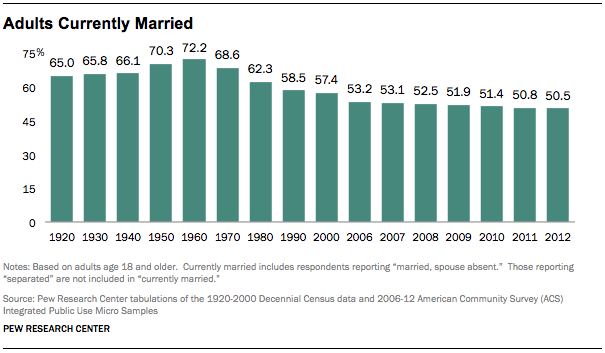
But, also consider: It is one thing to get married, it is another thing to stay married. In spite of the recent uptick in newlyweds since 2011, it is still the case that fewer adults were currently married in 2012 (50.5%) than in 2011 (50.8%). The share of adults presently married peaked around 72% in 1960.


