President Obama took on a topic yesterday that most Americans don’t like to talk about much: inequality. There are a lot of ways to measure economic inequality (and we’ll be discussing more on Fact Tank), but one basic approach is to look at how much income flows to groups at different steps on the economic ladder.
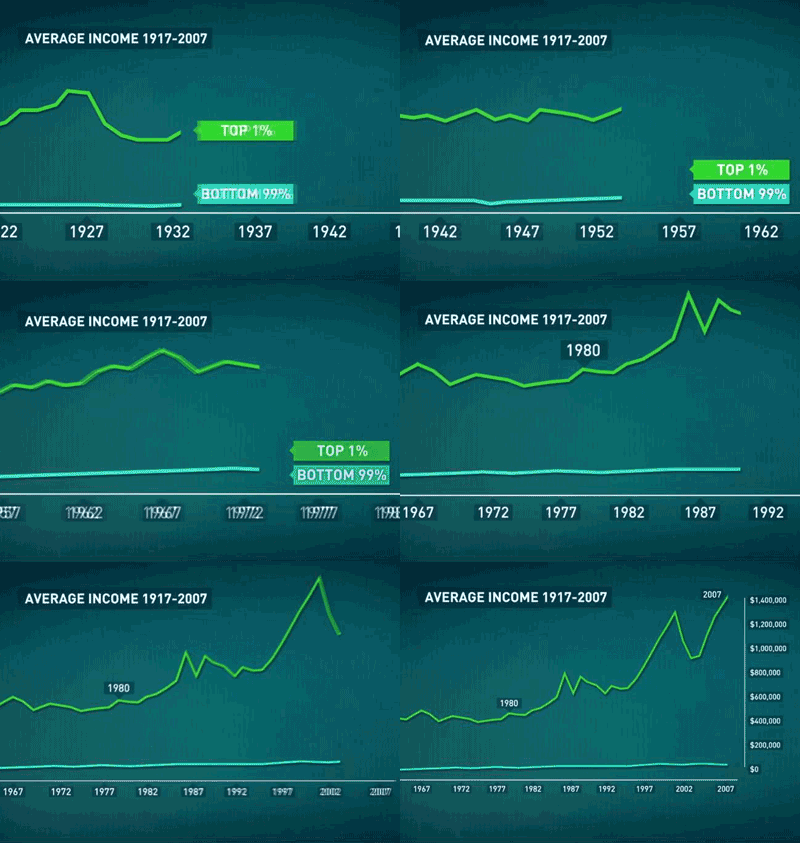
Emmanuel Saez, an economics professor at UC-Berkeley, has been doing just that for years. And according to his research, U.S. income inequality has been increasing steadily since the 1970s, and now has reached levels not seen since 1928. (The GIF file at the top of this post, created by Dorsey Shaw of Buzzfeed, compares growth in average income of the top 1% of Americans with everyone else.)
Using tax-return data from the IRS, Saez has built extensive income-distribution datasets going back 100 years. He defines “income” as pre-tax cash market income — wages and salaries; dividends, interest, rent and other returns on invested capital; business profits; and realized capital gains. He excludes Social Security payments, unemployment benefits and other government transfer payments, which are more substantial today than before the Great Depression.
In 1928, the top 1% of families received 23.9% of all pretax income, while the bottom 90% received 50.7%. But the Depression and World War II dramatically reshaped the nation’s income distribution: By 1944 the top 1%’s share was down to 11.3%, while the bottom 90% were receiving 67.5%, levels that would remain more or less constant for the next three decades.
But starting in the mid- to late 1970s, the uppermost tier’s income share began rising dramatically, while that of the bottom 90% started to fall. The top 1% took heavy hits from the dot-com crash and the Great Recession but recovered fairly quickly: Saez’s preliminary estimates for 2012 (which will be updated next month) have that group receiving nearly 22.5% of all pretax income, while the bottom 90%’s share is below 50% for the first time ever (49.6%, to be precise).
A century ago, Saez notes that the highest earners derived much of their income from earnings on the accumulated wealth of past generations. By contrast, “[t]he evidence suggests that top incomes earners today are…“working rich,” highly paid employees or new entrepreneurs who have not yet accumulated fortunes comparable to those accumulated during the Gilded Age.”
Americans aren’t unaware of these trends. More than half (61%) of Americans said the U.S. economic system favors the wealthy, while just 35% said it’s fair to most people, according to a Pew Research Center survey conducted in March. A similar share (66%) of Americans said the gap between rich and poor had increased in the past five years; nearly three-quarters of respondents said the rich-poor gap was either a “very big” (47%) or “moderately big” (27%) problem.
As one might expect, low- and middle-income people were most likely to say the U.S. economic system favors the wealthy, but even 52% of high-income people agreed that it does. And while 54% of low-income people and 49% of middle-income people called the rich-poor gap a “very big” problem, only 36% of high-income people did so. A third of the high-income group said the rich-poor gap was either a small problem (19%) or not a problem at all (14%).
More than half (55%) of Republicans said the economic system is fair to most people, but majorities of Democrats (75%) and independents (63%) said it favors the wealthy. And 61% of Democrats and 50% of independents said the gap was a very big problem, versus only 28% of Republicans. Four-in-ten Republicans termed the gap either a small problem (22%) or not a problem at all (18%).


