Many of the patterns described in this report vary by caste. In India, castes are hereditary social classes. Historically, the caste someone was born into determined their status in the social hierarchy, along with their social circle and what careers they could pursue. Caste also is tied to many family patterns – including sex selection. Sex ratios at birth, son preference and ultrasound use vary widely within religions, by caste.
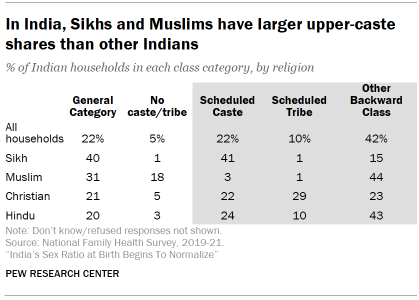
Upper-caste Sikhs, in particular, have a very imbalanced sex ratio at birth. Indeed, upper-caste families were primarily responsible for the large skew among Sikhs in India over the past two decades. This is partly a result of Sikhs’ relatively high share of upper-caste families.
The most recent National Family Health Survey uses five broad caste categories.36 These include three lower castes made up of groups that were historically disadvantaged and are eligible for tiered affirmative action programs known as “reservations.”
- Scheduled Caste, also known as Dalit (or by the pejorative term “untouchable”), is made up of groups that were traditionally ostracized and were relegated to “polluting” occupations like fishing, scavenging and sewer cleaning.
- Scheduled Tribe is made up of Indigenous peoples. Most of the Scheduled Tribe population lives in rural areas.
- Other Backward Class (OBC) is made up of Indians who inherited other social class identities that have been socially and educationally disadvantaged.
- General Category consists of people who do not fall into any socially or economically disadvantaged caste category. Brahmin – historically the priests and other religious leaders who also served as educators – is the General Category’s highest caste.37
- No caste/tribe is made up of a minority of Indians who do not identify with any caste or tribe.

Most Indian households (73%) belong to a caste category that is eligible for government reservations, according to the NFHS. But shares vary widely by religious affiliation, ranging from 49% of Muslims to 77% of Hindus. About three-quarters of Christian households (74%) belong to a historically disadvantaged caste, including 22% who say they are members of a Scheduled Caste.38 Just 4% of Muslims say they belong to a Scheduled Caste or Tribe, but more than four-in-ten (44%) say they are members of OBCs. In addition, among India’s major religious groups, Muslims are the most likely to say they have no caste or tribe.
Each group’s unique caste composition may influence its patterns of son preference, daughter aversion, and sex ratios at birth. This is not just because caste is an important indicator of socioeconomic status, but also because caste entails cultural norms that may limit women’s autonomy in different ways.

For example, Brahmin women (members of the General Category caste) are less likely to be employed or be allowed to work outside the home. Scheduled Caste women, on the other hand, often experience fewer restrictions on their freedom of mobility and employment, but they are also disproportionately victims of sexual violence.
Despite the caste system’s roots in historical Hindu writings, caste continues to affect the lives of Dalit non-Hindus in India. They are often regarded as socially inferior communities by their non-Dalit co-religionists and experience various forms of discrimination and exclusion, such as segregation in social interactions and in religious spaces.39
General Category women ages 15 to 49 express weaker son preference attitudes than other groups, according to the 2019-21 NFHS. Indian authorities exclude Scheduled Caste Christians and Muslims from government reservations.
When asked about the ideal gender composition of their children, 12% of General Caste women want to have more sons than daughters, compared with 16% of Scheduled Caste women, 16% of OBC women, and 18% of Scheduled Tribe women.

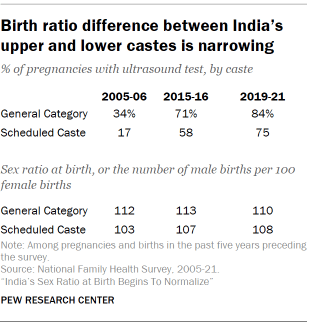
However, General Category women seem to be at least as likely as women from OBCs and Scheduled Castes to practice sex selection to avoid having daughters. The birth ratio after ultrasound use during pregnancy for General Category women is around 110 boys per 100 girls, compared with 109 among OBCs, 108 among Scheduled Castes, and a nearly balanced ratio of 104 boys per 100 girls among Scheduled Tribe women.
Combined with wider ultrasound use among upper-caste women, their sex ratio at birth tends to be more male-biased than that among lower-caste ones, especially in the past when gaps in ultrasound use were wider. For instance, the birth ratio among General Category women was 9 points wider than among women of Scheduled Castes in the 2005-06 NFHS, when the rate of ultrasound use among upper-caste women was twice as high.
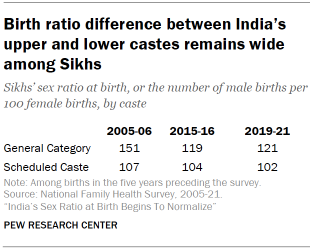
Among General Category Sikh women, the sex ratio at birth is 121 boys per 100 girls, significantly more imbalanced than among Scheduled Caste Sikhs (102). The sex ratio gap is smaller between General Category and Scheduled Caste Hindus (112 vs. 108). (The number of births by Muslim or Christian women in these caste categories is too small for this analysis.)

Land ownership may partially explain sex ratio differences by caste among Sikhs. Upper-caste Sikh households are more likely than underprivileged, Scheduled Caste Sikh households to own land (59% vs. 8%), according to NFHS data. Land-owning caste groups may be more motivated than others to avoid having daughters, especially when their regional norms exclude daughters from inheriting family property.40


